

Extending the history of child obesity in the United States: The Fels Longitudinal Study, birth years 1930-1993
- PMID: 23512972
- PMCID: PMC3695078
- DOI: 10.1002/oby.20395
Extending the history of child obesity in the United States: The Fels Longitudinal Study, birth years 1930-1993
Abstract
Objective: Little is known about the prevalence of child obesity in the US before the first national survey in 1963. There is disagreement about whether the obesity epidemic is entirely a recent phenomenon or a continuation of longstanding trends.
Design and methods: The BMIs of 1,116 children who participated in the Fels Longitudinal Study near Dayton, Ohio were analyzed. Children were born between 1930 and 1993 and measured between 3 and 18 years of age.
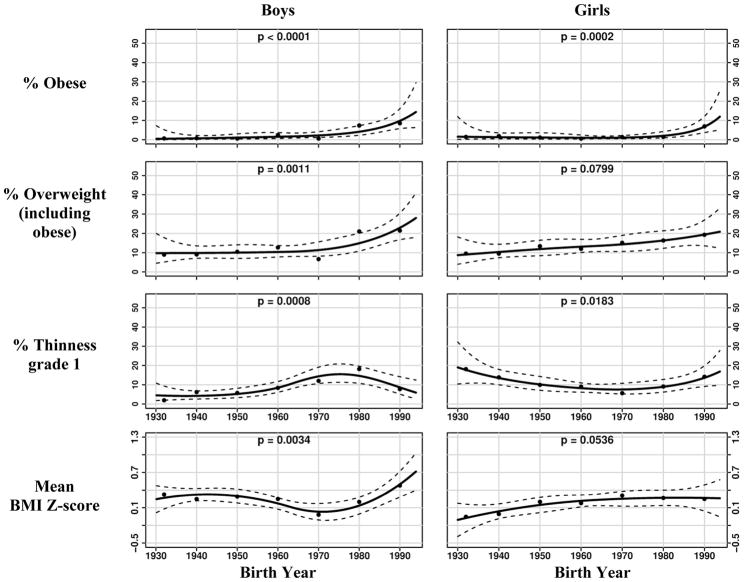
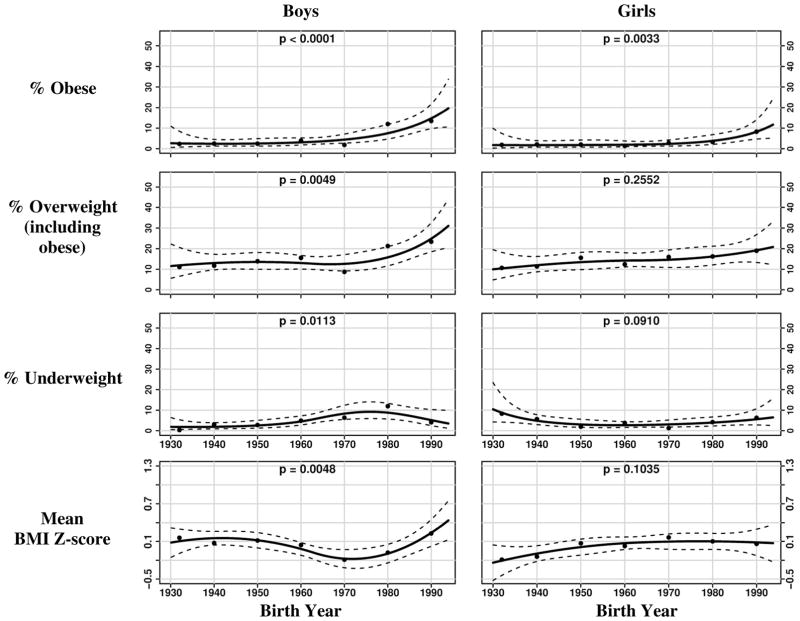
Results: Between the birth cohorts of 1930 and 1993, the prevalence of obesity rose from 0 to 14% among boys and from 2 to 12% among girls. The prevalence of overweight rose from 10 to 28% among boys and from 9 to 21% among girls. The mean BMI Z score rose from +0.25 to +0.72 among boys and from -0.11 to +0.26 among girls. Among boys, all these increases began after birth year 1970. Among girls, obesity began to rise after birth year 1980, but overweight and BMI Z-scores were already rising as early as the 1930s and 1940s.
Conclusions: Most of the results suggest that the child obesity epidemic was recent and sudden. The recency of the epidemic offers some hope that it may be reversed.
Copyright © 2013 The Obesity Society.
Conflict of interest statement
The authors have no conflicts of interest.
Figures
References
-
- Lobstein T, Jackson-Leach R. Child overweight and obesity in the USA: Prevalence rates according to IOTF definitions. International Journal of Pediatric Obesity. 2007;2(1):62–64. - PubMed
-
- Costa D, Steckel RH. Long-Term Trends in Health, Welfare, and Economic Growth in the United States. In: Steckel RH, Floud R, editors. Health and Welfare during Industrialization. Chicago, IL: University of Chicago Press; 1997. pp. 47–90.
-
- Komlos J, Brabec M. The trend of mean BMI values of US adults, birth cohorts 1882–1986 indicates that the obesity epidemic began earlier than hitherto thought. American Journal of Human Biology. 2010;22(5):631–638. - PubMed
Publication types
MeSH terms
Grants and funding
LinkOut - more resources
Full Text Sources
Other Literature Sources
Medical
