. 2013 Apr 2;110(14):5636-41.
doi: 10.1073/pnas.1216254110. Epub 2013 Mar 19.

Single-cell imaging of HIV-1 provirus (SCIP)

Affiliations

Single-cell imaging of HIV-1 provirus (SCIP)

Cristina Di Primio et al. Proc Natl Acad Sci U S A. .

Abstract

Recent advances in fluorescence microscopy provided tools for the investigation and the analysis of the viral replication steps in the cellular context. In the HIV field, the current visualization systems successfully achieve the fluorescent labeling of the viral envelope and proteins, but not the genome. Here, we developed a system able to visualize the proviral DNA of HIV-1 through immunofluorescence detection of repair foci for DNA double-strand breaks specifically induced in the viral genome by the heterologous expression of the I-SceI endonuclease. The system for Single-Cell Imaging of HIV-1 Provirus, named SCIP, provides the possibility to individually track integrated-viral DNA within the nuclei of infected cells. In particular, SCIP allowed us to perform a topological analysis of integrated viral DNA revealing that HIV-1 preferentially integrates in the chromatin localized at the periphery of the nuclei.


Conflict of interest statement

The authors declare no conflict of interest.

Figures

Fig. 1.
Fig. 1.
Detection of γ-H2AX foci associated with HIV-1 DNA in U2OS cells. (A) Schematic representation of viral constructs and mechanism of γ-H2AX foci formation. The plasmid pHR-CMVGFP was modified by inserting the I-SceI target site to produce either the HIV-CMVGFP-I-SceI virions expressing GFP in infected cells or the HIV-CMVΔGFP-I-SceI GFP deleted. The endonuclease I-SceI (blue spot) exogenously expressed by transfecting infected cells cleaves the I-SceI site producing DNA DSBs. H2AX molecules at the DSB site become phosphorylated forming γ-H2AX foci (red spots) detectable by immunofluorescence. (B) U2OS-6 and U2OS-8 stable cell clones containing pHR-CMVGFP-I-SceI and expressing or not expressing the I-SceI endonuclease (pCBASce) by transient transfection were immunostained with anti–γ-H2AX antibodies: γ-H2AX foci (in red) viral GFP expression (in green). Scale bars, 10 μm. (C) Chromatin immunoprecipitation (ChIP) analysis of viral DNA associated with γ-H2AX. (Upper) Schematic representation of the positions of the primers used for real-time PCR quantification. (Lower) The γ-H2AX ChIP analysis in the U2OS-8 cell clone expressing or not expressing the I-SceI endonuclease. Relative enrichment represents the enrichment of γ-H2AX compared with an IgG control (normalized with a PCR internal control to a locus other than the viral DNA). Error bars represent SDs from at least two independent experiments.
Fig. 2.
Fig. 2.
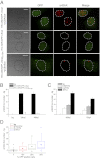
Visualization of viral DNA in infected cells. (A) Detection of γ-H2AX foci and GFP in cells expressing (Top) or lacking (Middle) the exogenous I-SceI endonuclease. Cells were infected by integration competent virus or by integration defective virus (D116A) (Bottom). Scale bars, 10 μm. (B) Quantification of γ-H2AX foci number at 24 and 48 hpi in cells infected with 4 RTU of pHR-CMVGFP-I-SceI or pHR-CMVGFP-I-SceID116A (means ±SEM from three independent experiments after background subtraction). At least 150 cells per experiment have been analyzed; [Pwt vs. D116A = 1.332e-15 at 24 hpi, Pwt vs. D116A = 4.692e-13 at 48 hpi, Kolmogorov–Smirnov test (KS test)]. (See Materials and Methods for background correction.) (C) Quantification of the number of γ-H2AX foci at 48 h and 13 d postinfection. Cells were infected with 0.004 RTU (white bars), 0.4 RTU (gray bars), or 4 RTU (black bars) (means ± SEM from at least two independent experiments after background subtraction); at least 200 cells per experiment have been analyzed. (D) Quantification of γ-H2AX foci number per cell with respect to percentage of GFP positive cells at the three different RTU after background subtraction; (P0.04RTU vs. bg = 0.04542, P0.4RTU vs. bg = 2.7e-5, P4RTU vs. bg = 2.9e-7, KS test).
Fig. 3.
Fig. 3.
SCIP analysis in transportin-SR2 knockdown cells and in anti-retroviral drug treated cells. (A) Immunofluorescence detection of γ-H2AX foci (yellow spots) in cells transfected with fluorescent siRNA (blue spots) targeting TRN-SR2 mRNA (siRNA-SR2) or a mismatch control siRNA (siRNA-MM) and infected with 4RTU of HIV-CMVΔGFP-I-SceI. HIV-CMVΔGFP-I-SceI virus was used to avoid the crosstalk between fluorophores. Nuclear middle z stacks are shown. Scale bars, 10 μm. (B) Quantification of γ-H2AX foci in cells transfected by siRNA-MM (black bars) and cells transfected by siRNA-SR2 (white bars) after background subtraction; (p MM+ISceI vs. SR2+ISceI = 7.946e-12, KS test). (C) Immunofluorescence detection of γ-H2AX foci (red spots) in infected cells (4 RTU) either untreated (ctrl) or treated with antiretroviral drugs as indicated. (Right) The γ-H2AX foci signal merged with the GFP signal. (D) Quantification of γ-H2AX foci in infected cells either untreated (ctrl-black bar) and in or treated as indicated (white bars) (means ±SEM from at least two independent experiments after background subtraction). Drugs concentrations are indicated. (Put vs. 100nM AZT = 9.555e-05, Put vs. 1uM = 4.485e-07, Put vs. 10uM = 4.384e-08, Put vs. 2uM nev = 0.0003, Put vs. 10uM nev = 8.572e-13, Put vs. 100nM ral = 3.466e-11, Put vs. 500nM ral < 2.2e-16, Put vs. 1uM ral < 2.2e-16, Put vs. 100nM CX = 0.0004, Put vs. 1uM CX = 3.046e-13, Put vs. 10uM CX = 6.122e-10, KS test). (See SI Materials and Methods for background correction.)
Fig. 4.
Fig. 4.
Analysis of the proviral DNA nuclear localization. (A) Immunofluorescence images of γ-H2AX foci (in red) and nuclear lamin (in blue) from U2OS cells infected with 4 RTU of HIV-CMVGFP-I-SceI. Nuclear middle z stacks are shown. Scale bars, 10 μm. (B) Distribution of the distances of γ-H2AX foci from the nuclear lamin. Black bars represent the frequency counts of γ-H2AX foci in cells infected with HIV-CMVGFP-I-SceI, red bars represent the frequency counts of γ-H2AX foci induced by NCS (P = 3.273e-10, KS test). (C) Immunofluorescence images of γ-H2AX foci (in red) and nuclear lamin (in blue) from CEMss T cells infected with 4 RTU of HIV-CMVGFP-I-SceI. Nuclear middle z stacks are shown. Scale bars, 10 μm. (D) Distribution of the distances of γ-H2AX foci from the nuclear lamin. Black bars represent the frequency counts of γ-H2AX foci in cells infected with HIV-CMVGFP-I-SceI, red bars represent the frequency counts of γ-H2AX foci induced by NCS (P = 0.0004, KS test). (E) Z sectioning of an infected CEMss nucleus. Scale bars, 10 μm.
Fig. 5.
Fig. 5.
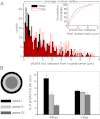
Analysis of the proviral DNA nuclear localization at different time points after infection. (A) Distribution of distances of proviruses from the nuclear lamin at 48 h (black bars) and 13 d postinfection (red bars) (P = 5.76e-08, KS test). (B) Data are represented in bar graphs as the percentage of γ-H2AX foci in the three concentric zones of equal surface area. The peripheral zone is in black, the middle zone in light gray, and the inner zone in gray.
Fig. 6.
Fig. 6.
Analysis of the proviral DNA retargeting. (A) Distribution of the distances of HIV-1 γ-H2AX foci from the nuclear lamin in HeLa control cells (black bars) and in cells expressing CBX-LEDGF325–530 (blue bars) (P = 2.147e-06, KS test). (B) Data are represented in bar graphs as the percentage of γ-H2AX foci in the three concentric zones of equal surface area as in Fig. 5B.

References

    1. Campbell EM, Perez O, Anderson JL, Hope TJ. Visualization of a proteasome-independent intermediate during restriction of HIV-1 by rhesus TRIM5alpha. J Cell Biol. 2008;180(3):549–561. - PMC - PubMed
    1. Campbell EM, Perez O, Melar M, Hope TJ. Labeling HIV-1 virions with two fluorescent proteins allows identification of virions that have productively entered the target cell. Virology. 2007;360(2):286–293. - PMC - PubMed
    1. Jha NK, et al. Imaging single retrovirus entry through alternative receptor isoforms and intermediates of virus-endosome fusion. PLoS Pathog. 2011;7(1):e1001260. - PMC - PubMed
    1. Jouvenet N, Bieniasz PD, Simon SM. Imaging the biogenesis of individual HIV-1 virions in live cells. Nature. 2008;454(7201):236–240. - PMC - PubMed
    1. Jouvenet N, Simon SM, Bieniasz PD. Imaging the interaction of HIV-1 genomes and Gag during assembly of individual viral particles. Proc Natl Acad Sci USA. 2009;106(45):19114–19119. - PMC - PubMed

Publication types

MeSH terms

Substances