Review
. 2013 Mar 26;7(3):1850-66.
doi: 10.1021/nn4012847. Epub 2013 Mar 20.

Nanotools for neuroscience and brain activity mapping

Affiliations
Review

Nanotools for neuroscience and brain activity mapping

A Paul Alivisatos et al. ACS Nano. .

Abstract

Neuroscience is at a crossroads. Great effort is being invested into deciphering specific neural interactions and circuits. At the same time, there exist few general theories or principles that explain brain function. We attribute this disparity, in part, to limitations in current methodologies. Traditional neurophysiological approaches record the activities of one neuron or a few neurons at a time. Neurochemical approaches focus on single neurotransmitters. Yet, there is an increasing realization that neural circuits operate at emergent levels, where the interactions between hundreds or thousands of neurons, utilizing multiple chemical transmitters, generate functional states. Brains function at the nanoscale, so tools to study brains must ultimately operate at this scale, as well. Nanoscience and nanotechnology are poised to provide a rich toolkit of novel methods to explore brain function by enabling simultaneous measurement and manipulation of activity of thousands or even millions of neurons. We and others refer to this goal as the Brain Activity Mapping Project. In this Nano Focus, we discuss how recent developments in nanoscale analysis tools and in the design and synthesis of nanomaterials have generated optical, electrical, and chemical methods that can readily be adapted for use in neuroscience. These approaches represent exciting areas of technical development and research. Moreover, unique opportunities exist for nanoscientists, nanotechnologists, and other physical scientists and engineers to contribute to tackling the challenging problems involved in understanding the fundamentals of brain function.


Conflict of interest statement

Conflict of Interest: The authors declare no competing financial interest.

Figures

Figure 1
Figure 1
Nanofabricated planar electrode array for high-density neuronal voltage recording. False-color SEM image of a portion of a 64-channel array patterned on a silicon substrate. Scale bar = 50 μm. Modified from ref . Copyright 2011 Du et al.
Figure 2
Figure 2
Three-dimensional nanoelectrode array (3D-NEA) for in vivo interrogation of neuronal networks. (a) Scanning electron microscope (SEM) image of the nine silicon nanoneedles that constitute the active region of a 3D-NEA. Dimensions of the nanoneedle electrodes are designed to facilitate single-cell intracellular electrical coupling. False colors show metal-coated tips (gray) and insulating silicon oxide (blue). Reprinted with permission from ref . Copyright 2012 Nature Publishing Group. (b) Scanning electron micrograph of a rat cortical cell (3 days in vitro, false colored yellow) on top of an electrode pad (false colored blue). Reprinted with permission from ref . Copyright 2012 Nature Publishing Group. (c) Stimulation and recording of rat cortical neurons. Upper traces show that action potentials (blue: measured by a patch pipet) could be reliably stimulated by voltage pulses applied to the nanoelectrodes (magenta). Similarly, lower traces show that the nanoelectrodes can record action potentials (magenta) stimulated by a patch pipet (blue). Reprinted with permission from ref . Copyright 2012 Nature Publishing Group. (d) Scanning electron micrograph of a representative 3D brain-interfacing device consisting of 24 probes, each containing arrays of active sites distributed along their length. Inset: optical image of the 3D probe array. Reprinted with permission from ref . Copyright 2012 Optical Society of America.
Figure 3
Figure 3
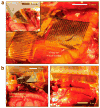
(a) Flexible, high-density active electrode arrays composed of semiconductor nanomembrane electronics transferred onto polymer substrates were placed on the visual cortex of a cat brain or (b) into the interhemispheric fissure (inset). Reprinted with permission from ref . Copyright 2011 Nature Publishing Group.
Figure 4
Figure 4
Miniature, mass-producible fluorescence microscope. (a) Cross-sectional schematic of the microscope design. Purple and green arrows show excitation and emission pathways, respectively. (b) Microscope (1.9 g) shown fully assembled with its LED light source, micro-optics, and camera. Insets show, clockwise from bottom-left, the fluorescence filter cube with excitation and emission filters and dichroic mirror; the mounted camera chip; and the LED light source. Scale bars for a, b, and insets are 5 mm. Reprinted with permission from ref . Copyright 2011 Nature Publishing Group.
Figure 5
Figure 5
Ca2+ imaging in >1200 CA1 pyramidal cells in freely moving mice. (a) Integrated microscope (Figure 4) is equipped with a microendoscope and images CA1 neurons expressing the Ca2+ indicator GCaMP3 via the Camk2a promoter. The base plate and microendoscope are fixed to the cranium, for repeated access to the same field of view. Reprinted with permission from ref . Copyright 2013 Nature Publishing Group. (b) 1202 CA1 pyramidal cells (red somata) identified by Ca2+ imaging in a freely moving mouse, atop a mean fluorescence image (green) of CA1. Vessels appear as dark shadows. Image courtesy of Yaniv Ziv and Lacey Kitch, Stanford University. (c) Example traces of Ca2+ dynamics from 15 cells. Scale bars: 5% ΔF/F (vertical) and 10 s (horizontal). Reprinted with permission from ref . Copyright 2013 Nature Publishing Group.
Figure 6
Figure 6
Actin retrograde flow rates at the leading edge of a PtK1 cell. The photoactivatable protein tdEos tagged to actin was expressed in PtK1 cells. Individual molecules were visualized through photoactivation with ultraviolet light. They were then tracked over time to reveal movement of individual actin molecules within actin filaments at the edge of the cells. A flow map of rates of actin filament movement from the cell surface is shown. Vector colors reflect flow speed (color bar), and arrows reflect direction. The scale bar is 10 μm. Reproduced with permission from ref . Copyright 2011 Nature Publishing Group.
Figure 7
Figure 7
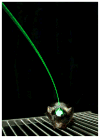
Brain activity mapping may be enabled, in part, by optogenetic preparations as shown here in a freely moving mouse; green light is delivered to deep or superficial brain areas via fiber optics. Optogenetic control of microbial protein-expressing targeted neurons enables (1) determination of causal significance of activity patterns; (2) in some cases, phototagging identification of cells from which electrical spikes are recorded; and (3) in some preparations, imaging of neural responses to control or stimulation. Advances in computational optics and nanoscale device engineering will further enable delivery of complex spatially modulated light patterns to the target tissue. Figure adapted from Inbal Goshen and Karl Deisseroth, Stanford University/HHMI.

Similar articles

Cited by

References

    1. Alivisatos AP, Chun M, Church GM, Greenspan RJ, Roukes ML, Chun M, Yuste R. The Brain Activity Map Project and the Challenge of Functional Connectomics. Neuron. 2012;74:970–974. - PMC - PubMed
    1. Andrews AM, Weiss PS. Nano in the Brain: Nano-Neuroscience. ACS Nano. 2012;6:8643–8644. - PubMed
    1. Alivisatos AP, Chun M, Church GM, Deisseroth K, Donoghue JP, Greenspan RJ, McEuen PL, Roukes M, Sejnowski TJ, Weiss PS, et al. The Brain Activity Map. Science. 2013 doi: 10.1126/science.1236939. - DOI - PMC - PubMed
    1. Underwood E. Brain Project Draws Presidential Interest, but Mixed Reactions. Science. 2013;339:1022–1023. - PubMed
    1. A Frequently Asked Questions file is available for the Brain Activity Mapping Project. http://www.kavlifoundation.org/BAM.

Publication types