. 2013 Apr 17;135(15):5620-30.
doi: 10.1021/ja310831m. Epub 2013 Apr 3.

Colocalization of the ganglioside G(M1) and cholesterol detected by secondary ion mass spectrometry

Affiliations

Colocalization of the ganglioside G(M1) and cholesterol detected by secondary ion mass spectrometry

Mónica M Lozano et al. J Am Chem Soc. .

Abstract

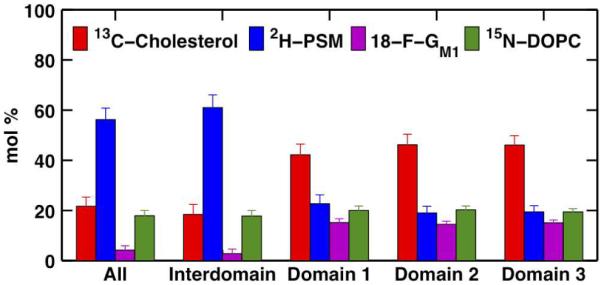
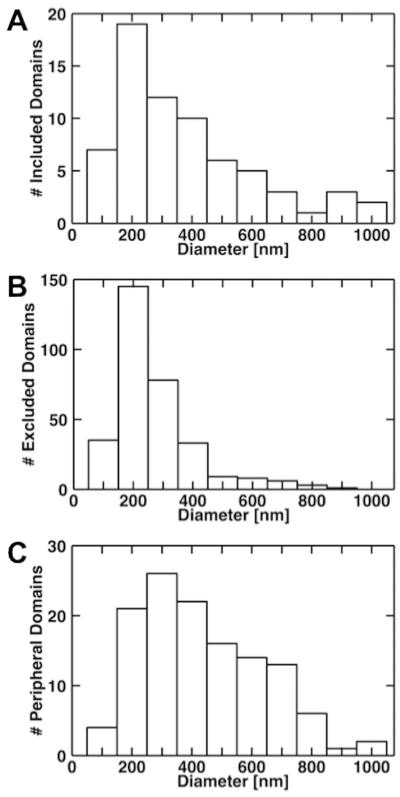
The characterization of the lateral organization of components in biological membranes and the evolution of this arrangement in response to external triggers remain a major challenge. The concept of lipid rafts is widely invoked; however, direct evidence of the existence of these ephemeral entities remains elusive. We report here the use of secondary ion mass spectrometry (SIMS) to image the cholesterol-dependent cohesive phase separation of the ganglioside GM1 into nano- and microscale assemblies in a canonical lipid raft composition of lipids. This assembly of domains was interrogated in a model membrane system composed of palmitoyl sphingomyelin (PSM), cholesterol, and an unsaturated lipid (dioleoylphosphatidylcholine, DOPC). Orthogonal isotopic labeling of every lipid bilayer component and monofluorination of GM1 allowed generation of molecule specific images using a NanoSIMS. Simultaneous detection of six different ion species in SIMS, including secondary electrons, was used to generate ion ratio images whose signal intensity values could be correlated to composition through the use of calibration curves from standard samples. Images of this system provide the first direct, molecule specific, visual evidence for the colocalization of cholesterol and GM1 in supported lipid bilayers and further indicate the presence of three compositionally distinct phases: (1) the interdomain region; (2) micrometer-scale domains (d > 3 μm); (3) nanometer-scale domains (d = 100 nm to 1 μm) localized within the micrometer-scale domains and the interdomain region. PSM-rich, nanometer-scale domains prefer to partition within the more ordered, cholesterol-rich/DOPC-poor/GM1-rich micrometer-scale phase, while GM1-rich, nanometer-scale domains prefer to partition within the surrounding, disordered, cholesterol-poor/PSM-rich/DOPC-rich interdomain phase.


Figures

Figure 1
Figure 1. Schematic of the NanoSIMS experiments
A cesium ion beam is rastered across a surface generating secondary ions (12C, 13C, 12C2H, 19F, 12C14N, and 12C15N) from the components of a supported lipid bilayer shown as a phase separated mixture of 13C-Cholesterol, 2H31-Palmitoyl Sphingomyelin (2H-PSM), 18-F-GM1, and 15N-DOPC (see Scheme 1).
Figure 2
Figure 2
NanoSIMS images of a freeze-dried supported lipid bilayer formed by the fusion of a giant unilamellar vesicle composed of 2:2:1 2H-Sphingomyelin:15N-DOPC:13C-Cholesterol with 5 mol% 18-F-GM1 to an SiO2/Si substrate highlighting each component by isotopic or fluorine label along with a secondary electron image. Grayscale bar in secondary electron image represents secondary electron counts. Color bars in molecule-specific images represent percent molar composition from quantitative analysis.
Figure 3
Figure 3
Maps of regions of interest within the lipid bilayer from Figure 2 highlighting (A) three compositionally distinct phases corresponding to: (1) Interdomain region (light gray); (2) micrometer-scale Domains 1, 2, and 3 (gray); and, (3) nanometer-scale domains (black) localized within the micrometer-scale domains (referred to as “Included” Domains); and (B) nanometer-scale domains localized within the interdomain region (black) and the edge (gray) of the lipid the bilayer (referred to as “Excluded” and “Peripheral” Domains, respectively).
Figure 4
Figure 4
Quantitative compositional analysis of the entire lipid bilayer (All); the interdomain region (Interdomain, light gray region in Figure 3A); and, the three micrometer-scale domains (Domains 1, 2, and 3 in order of increasing size, gray regions in Figure 3A).
Figure 5
Figure 5
Size distributions of the nanometer-scale domains localized within the micrometer-scale domains, the interdomain region, and the edge of the lipid bilayer referred to as included (A), excluded (B), and peripheral domains (C), respectively.
Figure 6
Figure 6
Quantitative compositional analysis of the nanometer-scale domains localized within the micrometer-scale domains, the interdomain region, and the edge of the lipid bilayer referred to as included, excluded, and peripheral domains, respectively.
Figure 7
Figure 7
Co-localization of lipid bilayer components. The color bar represents co-localization score values. Score values less than 0.3 indicate low co-localization and more than 0.3 indicate high co-localization (see text).
Scheme 1
Scheme 1
Structural representatives of labeled molecules to facilitate NanoSIMS analysis of supported lipid bilayers.

References

    1. Lingwood D, Simons K. Science. 2010;327:46–50. - PubMed
    1. Hancock JF. Nat. Rev. Mol. Cell Biol. 2006;7:456–462. - PMC - PubMed
    1. Feigenson GW. Biochim. Biophys. Acta. 2009;1788:47–52. - PMC - PubMed
    1. Dietrich C, Yang B, Fujiwara T, Kusumi A, Jacobson K. Biophys. J. 2002;82:274–284. - PMC - PubMed
    1. Schütz GJ, Kada G, Pastushenko VP, Schindler H. EMBO J. 2000;19:892–901. - PMC - PubMed

Publication types