. 2013 Sep;7(9):1669-77.
doi: 10.1038/ismej.2013.37. Epub 2013 Mar 21.

Global marine bacterial diversity peaks at high latitudes in winter

Affiliations

Global marine bacterial diversity peaks at high latitudes in winter

Joshua Ladau et al. ISME J. 2013 Sep.

Erratum in

  • ISME J.2013 Sep;7(9)1876

Abstract

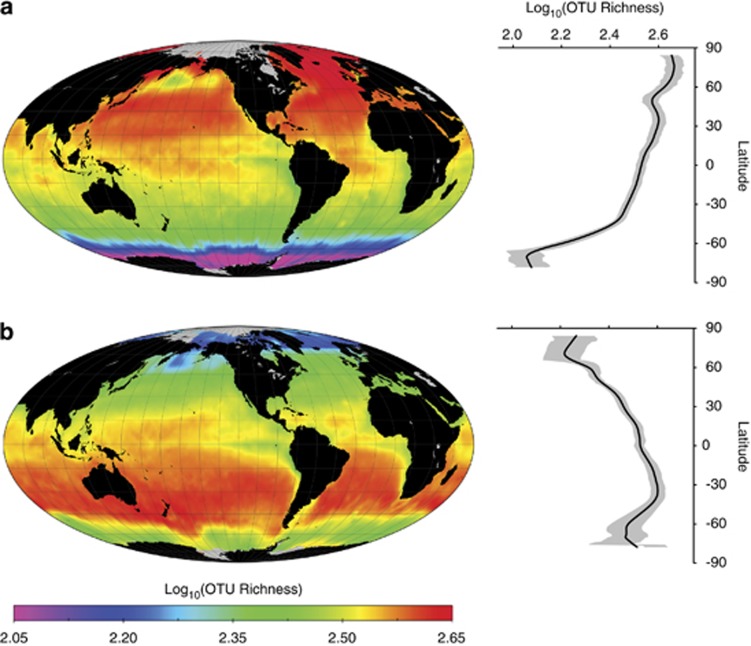
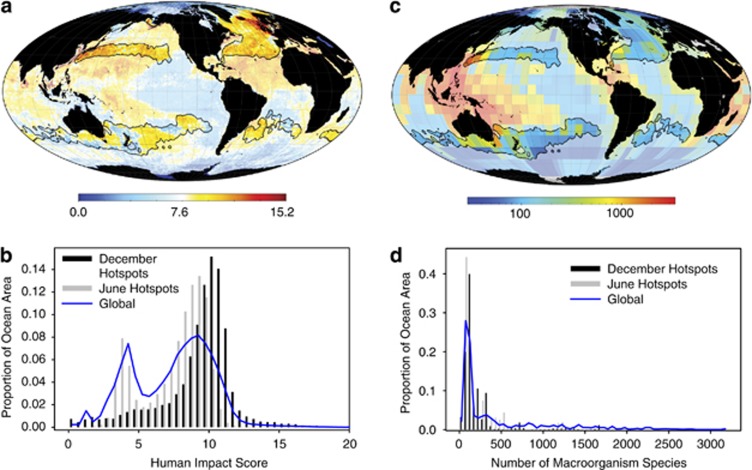
Genomic approaches to characterizing bacterial communities are revealing significant differences in diversity and composition between environments. But bacterial distributions have not been mapped at a global scale. Although current community surveys are way too sparse to map global diversity patterns directly, there is now sufficient data to fit accurate models of how bacterial distributions vary across different environments and to make global scale maps from these models. We apply this approach to map the global distributions of bacteria in marine surface waters. Our spatially and temporally explicit predictions suggest that bacterial diversity peaks in temperate latitudes across the world's oceans. These global peaks are seasonal, occurring 6 months apart in the two hemispheres, in the boreal and austral winters. This pattern is quite different from the tropical, seasonally consistent diversity patterns observed for most macroorganisms. However, like other marine organisms, surface water bacteria are particularly diverse in regions of high human environmental impacts on the oceans. Our maps provide the first picture of bacterial distributions at a global scale and suggest important differences between the diversity patterns of bacteria compared with other organisms.


Figures

Figure 1
Figure 1
Maps of predicted global marine bacterial diversity. Color scale shows relative richness of marine surface waters as predicted by SDM. Samples were rarefied to 4266 rDNA sequences to enable accurate estimation of relative richness patterns on a global scale from data sets with different sequencing depths. True richness is expected to exceed estimated values. (a) In December, OTU richness peaks in temperate and higher latitudes in the Northern Hemisphere. (b) In June, OTU richness peaks in temperate latitudes in the Southern Hemisphere. Predicted richness during the spring and fall is intermediate, with roughly globally uniform richness near the equinoxes (movie available in Supplementary File 2). Predicted richness patterns remain qualitatively the same regardless of the taxonomic classification method (Supplementary Figure S2), modeling method (Supplementary Figure S3), choice of environmental predictors (Supplementary Figure S4) and sequencing depth (Supplementary Figure S5). Error rates for the predictions are generally low, as indicated by 95% confidence intervals on the marginal plots (right panels, shaded gray) and maps of standard errors (Supplementary Figure S6). Grayed regions on the maps are areas where environmental raster data and, hence, predictions are unavailable. Richness estimates in most regions are interpolated rather than extrapolated (Supplementary Figure S7).
Figure 2
Figure 2
Range maps of representative genera. Each map shows the probability that a randomly selected rDNA sequence belongs to a particular genus (that is, relative abundance). Primarily autotrophic genera, such as Prochlorococcus and Synechococcus (grouped together by sequence classifier used here; see Methods Summary and Supplementary Methods), occur in high abundance in the tropics and mid-latitudes. Other genera show seasonally variable, high relative abundance (Pelagibacter) or summertime blooms (Polaribacter). The distributions of other taxa follow more complex patterns (Sphingopyxis). Figure S33 presents color versions of these maps.
Figure 3
Figure 3
Patterns of OTU richness within bacterial phyla. Columns show maps for different phyla; rows show maps for different seasons. Within the Cyanobacteria, richness peaks primarily at low latitudes, as might be expected for primarily autotrophic taxa. Within the Alphaproteobacteria, richness is distributed similarly to all bacteria taken together. Among Actinobacteria, richness follows primary productivity. Gammaproteobacteria show high polar diversity in the winter. Patterns within other representative phyla are shown in Supplementary Figure S34. Figure S35 presents color versions of these maps.
Figure 4
Figure 4
Bacterial diversity hotspots. (a) Hotspots of marine bacterial richness overlaid on a map of human impacts to the oceans (Halpern et al., 2008). Hotspots are outlined with black borders, and are defined as the 10% of ocean surface with the greatest diversity in December and June (primarily in the Northern and Southern hemispheres, respectively). (b) The distribution of human impacts across the entire ocean and within December and June diversity hotspots. December and June diversity hotspots have disproportionately high levels of human impacts. (c) Hotspots of marine bacterial richness overlaid on a map of marine macroorgnism diversity (Tittensor et al., 2010) and (d) the distribution of macroorganism richness across the entire ocean and within hotspots. Macroorganism diversity is disproportionately low within bacterial hotspots.

References

    1. Barton AD, Dutkiewicz S, Flierl G, Bragg J, Follows MJ. Patterns of diversity in marine phytoplankton. Science. 2010;327:1509–1511. - PubMed
    1. Caporaso JG, Paszkiewicz K, Field D, Knight R, Gilbert JA. The western english channel contains a persistent microbial seed bank. ISME J. 2012;6:1089–1093. - PMC - PubMed
    1. Elith J, Graham CH, Anderson RP, Dudik M, Ferrier S, Guisan A, et al. Novel methods improve prediction of species distributions from occurrence data. Ecography. 2006;29:129–151.
    1. Elith J, Kearney M, Phillips S. The art of modelling range-shifting species. Method Ecol Evol. 2010;1:330–342.
    1. Ferrier S, Guisan A. Spatial modelling of biodiversity at the community level. J Appl Ecol. 2006;43:393–404.

Publication types