. 2013 May;87(10):5937-48.
doi: 10.1128/JVI.03522-12. Epub 2013 Mar 20.

Glycoprotein H and α4β1 integrins determine the entry pathway of alphaherpesviruses

Affiliations

Glycoprotein H and α4β1 integrins determine the entry pathway of alphaherpesviruses

Walid Azab et al. J Virol. 2013 May.

Abstract

Herpesviruses enter cells either by direct fusion at the plasma membrane or from within endosomes, depending on the cell type and receptor(s). We investigated two closely related herpesviruses of horses, equine herpesvirus type 1 (EHV-1) and EHV-4, for which the cellular and viral determinants routing virus entry are unknown. We show that EHV-1 enters equine epithelial cells via direct fusion at the plasma membrane, while EHV-4 does so via an endocytic pathway, which is dependent on dynamin II, cholesterol, caveolin 1, and tyrosine kinase activity. Exchange of glycoprotein H (gH) between EHV-1 and EHV-4 resulted in rerouting of EHV-1 to the endocytic pathway, as did blocking of α4β1 integrins on the cell surface. Furthermore, a point mutation in the SDI integrin-binding motif of EHV-1 gH also directed EHV-1 to the endocytic pathway. Cumulatively, we show that viral gH and cellular α4β1 integrins are important determinants in the choice of alphaherpesvirus cellular entry pathways.


Figures
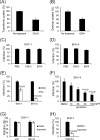
Fig 1
Fig 1
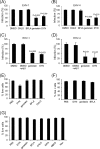
EHV-1 and EHV-4 infection in the presence of different inhibitors. (A, B) Chlorpromazine (CHLO) and EIPA block transferrin and dextran uptake, respectively. ED cells (untreated or pretreated with 10 μg/ml CHLO or 75 μM EIPA) were incubated with Alexa Fluor 647-labeled transferrin (50 μg/ml) or FITC-labeled dextran (1 mg/ml), respectively. After 1 h, cells were washed and the uptake of transferrin or dextran was analyzed by flow cytometry. ED (C to G), RK13 (G), or CHO-K1 (H) cells were either mock treated or treated with CHLO and EIPA (C, D), nocodazole (Noc) (E), or genistein (F to H) and infected with either EHV-1 or EHV-4 (MOI = 5) as indicated in Materials and Methods. At 8 to 12 h after infection, the percentage of infected cells was determined by flow cytometry. Error bars represent the mean ± standard deviation of three independent experiments. The infection rate in the absence of inhibitors was set to 100%.
Fig 2
Fig 2
Effects of dynasore (DYN) and BFLA on EHV-1 and EHV-4 entry. (A) ED cells were infected with EHV-4 (MOI = 5) in the presence of increasing doses of dynasore. (B) ED or RK13 cells were infected with EHV-1 (MOI = 5) in the presence or absence of dynasore at a concentration of 80 μM. (C to E) ED, RK13, or CHO-K1 cells were infected with either EHV-4 or EHV-1 in the presence or absence of BFLA at a concentration of 2 μM. At 8 to 12 h after infection, cells were detached and the percentage of infected cells was determined by flow cytometry. Infection rates in the absence of inhibitors was set to 100%. (F) ED cells were incubated with Alexa Fluor 647-labeled transferrin (50 μg/ml) (in the presence or absence of dynasore at 80 μM or BFLA at 2 μM). After 1 h, cells were washed and the uptake of transferrin was analyzed by flow cytometry. Error bars represent the mean ± standard deviation of three independent experiments.
Fig 3
Fig 3
EHV-4 entry into ED cells is cholesterol dependent. ED cells were incubated with either filipin (5 μg/ml) or MβCD (20 mM) for 30 min before infection with EHV-4 (A) or EHV-1 (B). (C) ED cells were incubated with Alexa Fluor 647-labeled cholera toxin B (0.5 μg/ml) in the presence or absence of either filipin (5 μg/ml) or MβCD (20 mM). After 30 min, cells were washed and the internalization of cholera toxin B was analyzed by flow cytometry. (D) ED cells were infected with EHV-4 in the presence of increasing doses of MβCD. The percentage of infected cells was determined by flow cytometry. The percentage of infection in the absence of inhibitors was set to 100%. Error bars represent the mean ± standard deviation of three independent experiments.
Fig 4
Fig 4
Entry of EHV-1gH4 and EHV-4gH1 into ED cells. Cells were treated with different inhibitors, as indicated, before infection (MOI = 5) with either EHV-1gH4 (A to D) or EHV-4gH1 (E) for 8 to 12 h. The percentage of infected cells was determined by flow cytometry. The percentage of infection in the absence of inhibitors was set to 100%. Error bars represent the mean ± standard deviation of three independent experiments. CHLO, chlorpromazine; GEN, genistein; Noc, nocodazole.
Fig 5
Fig 5
EHV-1gHS440A entry into ED cells. Cells were pretreated with genistein (A), dynasore (DYN) (B), MβCD (C), EIPA, or nocodazole (Noc) (D) before infection with EHV-1gHS440A (MOI = 5). At 8 to 12 h after infection, monolayers were detached and the percentage of infected cells was determined by flow cytometry. The percentage of infection in the absence of inhibitors was set to 100%. Error bars represent the mean ± standard deviation of three independent experiments.
Fig 6
Fig 6
Effects of MAb P4C2 and soluble α4β1 integrin on EHV-1 entry. ED cells were incubated with 20 μg/ml of anti-α4β1 integrin MAb P4C2. After washing, cells were incubated with the indicated inhibitors before infection with EHV-1 (A) or EHV-4 (B) at an MOI of 5. (C, D) EHV-1 or EHV-4 was incubated with soluble α4β1 integrin before infection of ED cells in the presence of the indicated inhibitors. At 8 to 12 h after infection, the percentage of infected cells was determined by flow cytometry. The percentage of infection in the absence of inhibitors was set to 100%. Error bars represent the mean ± standard deviation of three independent experiments. (E to G) Toxicity assays for pharmacological inhibitors on different cells. Pharmacological inhibitor uptake in CHO-K1 (E), RK-13 (F), or ED (G) cells following 7 h of incubation with the indicated inhibitors. The number of live cells (no pharmacological inhibitor uptake) relative to the total cell population was determined after flow cytometric analysis and is given in percent. Error bars represent the means ± standard deviations of two independent experiments.
Fig 7
Fig 7
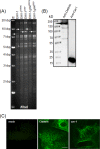
Identification of mRFP1-labeled viruses. (A) Purified DNA from parental EHV-1 or mRFP1-labeled viruses was digested with NheI. mRFP1 was inserted into VP26, which is located within a 7.6-kbp NheI fragment. This band disappeared and was replaced by a band of around 9.3 kbp because of the insertion of mRFP1Kanr in the case of EHV-1RFPK and EHV-1gH4RFPK. The removal of the gene for Kanr subtracted 1 kbp from the final constructs (EHV-1RFP and EHV-1gH4RFP), and a fragment of around 8.3 kbp appeared. Fragments in the mutants that appeared as a consequence of the insertion of the mRFP1 sequence are marked by arrows. (B) Detection of clathrin and Cav-1 expression by Western blot analysis. ED cell lysates were prepared, and proteins were separated by SDS–10% PAGE before transfer to a polyvinylidene difluoride membrane. Blots were incubated with anti-clathrin or anti-Cav-1 antibody (1/200 dilution), followed by anti-rabbit IgG peroxidase antibodies (1/10,000 dilution). (C) Indirect immunofluorescence detection of clathrin and Cav-1. ED cells were grown and fixed on gridded MatTek coverslips. Cells were subsequently stained with anti-clathrin or anti-Cav-1 antibodies, followed by Alexa Fluor 488-labeled goat anti-rabbit IgG (1:1,000). Cells were imaged with a Zeiss LSM 510 confocal microscope. Images were taken with a 63× oil immersion objective. The scale bar represents 5 μm.
Fig 8
Fig 8
Colocalization of viral particles with caveolin during entry. ED cells were incubated with EHV-1RFP, EHV-4, or EHV-1gH4RFP (MOI = 20) at 4°C for 2 h as indicated. The medium was replaced with preheated medium at 37°C, and cells were fixed at 5 min after the temperature shift. Cells were stained with anti-Cav-1 (green, A, C, E, G, H), anti-clathrin (green, B, D, F), and/or anti-EHV-4gD antibodies (red, C, D). (G) Cells were first incubated with anti-α4β1 integrin MAb before infection with EHV-1RFP. (H) EHV-1RFP was preincubated with soluble α4β1 integrin before addition to cells. (I) Numbers of virus particles colocalizing with caveolin signals after infection with various viruses and in the presence of antibodies or soluble integrins as determined in randomly selected fields of infected ED cells. The scale bars in panels A to H represent 5 μm.
Fig 9
Fig 9
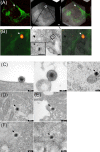
Correlative fluorescence and electron microscopy. (A, B) The location of an EHV-1gH4RFP particle colocalized with a Cav-1-positive cellular compartment was visualized by confocal laser scanning microscopy and corresponds to a virus-containing vesicle imaged by TEM (left panel, fluorescence image; middle panel, electron micrograph; right panel, correlation of fluorescence image with electron micrograph by alignment of cellular surface structures). The particle of interest is indicated by white arrows (fluorescent signal) and within a vesicular intracellular compartment by a black arrow. Scale bars: 2 μm (A) and 200 nm (B). (C to F) EM analysis of virus entry into ED cells. The same fields of confocal microscopy were used for further analysis by TEM. EHV-1RFP (C), EHV-4 (D), EHV-1gH4 RFP (E), or ED (F) cells were first incubated with anti-α4β1 integrin antibodies before infection with EHV-1RFP (left panel), or EHV-1RFP was incubated with soluble α4β1 integrin before the infection of ED cells (right panel). Scale bar sizes are indicated.
Fig 10
Fig 10
Putative model of the route of entry of EHV-1 and EHV-4 into equine epithelial cells. Virions first attach to target cells via gC and/or gB, which binds to heparin sulfate- and chondroitin-containing cell surface proteoglycans. (A) In the case of wild type EHV-1, fusion at the plasma membrane starts with gD binding to its cognate receptor (MHC-I), followed by the activation of a gH/gL complex that can “prime” gB fusion activity. Yet, a strong interaction between gH1 and α4β1 integrins, as well as at least one additional (unknown) viral factor, must occur before fusion can take place. (B) The interruption of this “fusion complex” prevents fusion with the plasma membrane; however, the virus is redirected to the endocytic pathway, which leads to the efficient release of nucleocapsids into the cytoplasm. Sol., soluble; Ab, antibody.

References

    1. Stein BS, Gowda SD, Lifson JD, Penhallow RC, Bensch KG, Engleman EG. 1987. pH-independent HIV entry into CD4-positive T cells via virus envelope fusion to the plasma membrane. Cell 49:659–668 - PubMed
    1. Matlin KS, Reggio H, Helenius A, Simons K. 1981. Infectious entry pathway of influenza virus in a canine kidney cell line. J. Cell Biol. 91:601–613 - PMC - PubMed
    1. Mercer J, Schelhaas M, Helenius A. 2010. Virus entry by endocytosis. Annu. Rev. Biochem. 79:803–833 - PubMed
    1. Rahn E, Petermann P, Hsu MJ, Rixon FJ, Knebel-Morsdorf D. 2011. Entry pathways of herpes simplex virus type 1 into human keratinocytes are dynamin- and cholesterol-dependent. PLoS One 6:e25464 doi:10.1371/journal.pone.0025464 - DOI - PMC - PubMed
    1. Schelhaas M, Shah B, Holzer M, Blattmann P, Kuhling L, Day PM, Schiller JT, Helenius A. 2012. Entry of human papillomavirus type 16 by actin-dependent, clathrin- and lipid raft-independent endocytosis. PLoS Pathog. 8:e1002657 doi:10.1371/journal.ppat.1002657 - DOI - PMC - PubMed

Publication types

Substances

LinkOut - more resources