. 2013 May;87(10):5916-25.
doi: 10.1128/JVI.00398-13. Epub 2013 Mar 20.

Characteristics of the cellular receptor influence the intracellular fate and efficiency of virus infection

Affiliations

Characteristics of the cellular receptor influence the intracellular fate and efficiency of virus infection

Robin L Krueger et al. J Virol. 2013 May.

Abstract

The intracellular fate of internalized virus-receptor complexes is suspected of influencing the efficiency of virus infection. However, direct evidence of a link between infection and the fate of internalized virus has been difficult to obtain. To directly address this question, we generated human 293 cell lines stably expressing comparable cell surface levels of three different members of the somatostatin receptor family (SSTR) which have natural differences in intracellular trafficking. Utilizing a glycoprotein that recognizes SSTR, we found that distinctive receptor subtype-specific destinations correlated with observable differences in the level of infection. Infection via SSTR-2 and -3 is restricted at a point after receptor binding and endocytosis but prior to penetration into the host cytoplasm. In contrast, entry via SSTR-5 featured a slower internalization with greater dependence on cholesterol. Quantitative real-time PCR showed that virus bound to SSTR-5 was directed to an intracellular environment that allowed near-wild-type (WT) levels of penetration, possibly due to a more favorable complement of host cell proteases, whereas SSTR-2 and -3 directed virions to a degradative compartment in which cytosol penetration was less efficient. Taken together, the results support that the superior receptor capacity of SSTR-5 results from its internalization into a cellular compartment that is more favorable to the cytoplasmic penetration of viral cores and reverse transcription. They suggest that the intracellular destination of internalized complexes is an important characteristic of a virus receptor and may have exerted a selective pressure on the choice of an entry receptor during evolution of viral glycoproteins.


Figures

Fig 1
Fig 1
SSTR-5 exhibits a greater entry receptor capacity than SSTR-2 or -3. (A) Schematic representation of the surface subunit of wild-type ecotropic Moloney (WT) (top) and Sst-RBS (bottom) envelope glycoproteins with the locations of the receptor binding site (RBS) in the WT and the peptide sequence YASAGCKNFFWKTFTSCAYTAS, containing the SST-14 ligand (underlined). RBD, receptor binding domain; PRR, proline-rich region; CTD, carboxy-terminal domain. (B) 293/SSTR-2, -3, and -5 cells stably express comparable levels of target receptors on their cell surface. The steady-state level of each SSTR subtype was quantified by flow cytometry using monoclonal antibody to the HA1 epitope tag located on the extracellular, amino terminus of each receptor subtype. Representative histograms (white, 293 cells expressing SSTR subtypes; black, background binding of the antibody to control 293 cells) are shown, with values indicating the fold increase in mean fluorescent intensity over levels for control 293 cells. (C) 293 cells or the receptor-matched 293/SSTR-2, -3, or -5 populations were exposed to 10-fold serial dilutions of Sst-RBS (black bars) or VSV G MLV (white bars), and the endpoint titrations were determined. Sst-RBS MLV titers ranged from 2.5 × 10⁵ to 5.0 × 10⁵ TU/ml on 293/SSTR-5 cells (mean of 3.3 × 10⁵), from 1.0 × 10³ to 2.5 × 10³ TU/ml on 293/SSTR-2 cells (mean of 1.5 × 10³), and from 0.75 × 10⁴ to 2.5 × 10⁴ TU/ml on 293/SSTR-3 cells (mean of 1.4 × 10⁴). The means ± SD for VSV G and Sst-RBS MLV infection of control 293 cells were adapted from a previous report (13). The means ± SD for Sst-RBS MLV infection of 293/SSTR-5 cells were calculated from three titrations, two of which were previously reported (13). (D) Cells were exposed to Sst-RBS LV (black bars) or VSV G LV (white bars), and infection was analyzed by flow cytometry for GFP expression. Relative transduction values represent the mean GFP fluorescence intensity for each sample. Data represent the means ± SD for three independent experiments (n = 4). P values were calculated using one-way analysis of variance (ANOVA) and Bonferroni posttest. *, P ≤ 0.05; **, P ≤ 0.01.
Fig 2
Fig 2
Receptor-specific interactions mediate Sst-RBS MLV infection. (A) Sst-RBS MLV infection was inhibited by preabsorption of cells with the SSTR agonist, SST-14. 293 and 293/SSTR-2, -3, and -5 cells were incubated with 1 μM SST-14 peptide or mock treated for 30 min prior to spinoculation of Sst-RBS MLV in the presence of 1 μM SST-14 peptide or mock. Values show the mean relative infection ± SD in the presence of the peptide, calculated as follows: (infection in the presence of SST-14/infection in its absence) × 100. (B) The peptide agonist did not affect infection of control pseudovirions. Cells were treated as for panel A except that infection was performed with WT (black bars) or VSV G MLV (gray bars) pseudovirion stocks. (C) The peptide agonist did not act by inhibiting cell division. The mean number of cell divisions was determined by counting the number of cells in each β-galactosidase-positive focus from the VSV G MLV data in panel B. All values represent the means ± SD for three independent experiments (n = 4). P values were calculated using two-way ANOVA and the Bonferroni posttest. *, P ≤ 0.05; **, P ≤ 0.01.
Fig 3
Fig 3
SSTR-expressing cells bind comparable levels of Sst-RBS MLV. (A) A standard equilibrium virus binding assay was performed using Sst-RBS MLV incubated with 293 or SSTR-expressing cells. Antiserum to the MLV glycoprotein was used to detect surface-bound virus by flow cytometry analysis. Representative histograms from three independent experiments are shown, with surface-bound virus (black lines) next to their mock-exposed counterparts (gray lines). The histogram for 293/SSTR-5 cells was adapted from a previous report (13). (B) Schematic showing the location of quantitative real-time PCR amplicons within the recombinant MLV genome used in infection experiments. U3, unique 3′; R, repeat sequence; U5, unique 5′; LacZ, β-galactosidase gene; SV40, simian virus 40 promoter; Neo r, neomycin resistance gene. (C) The relative levels of cell-associated pseudovirions were comparable for the three subtypes. Cells were incubated with Sst-RBS MLV or with mock medium, unbound virus was removed, cell were lysed, and the DNA was isolated and used directly as the template for quantitative real-time PCR. The level of cell-associated virus in the SSTR-expressing cells was determined as the relative fold increase of the MSS amplicon for each SSTR-expressing cell line over the 293 signal (representing nonspecific binding) normalized to endogenous β-actin. No amplification was detected in mock-exposed cells. Data represent three independent experiments (n = 3). P values were calculated using one-way ANOVA and the Bonferroni posttest.
Fig 4
Fig 4
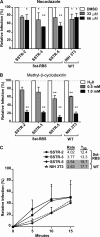
A lower rate of internalization correlates with a greater level of infection. 293, 293/SSTR-2, -3, and -5, or NIH 3T3 cells were pretreated with DMSO or 33 μM or 66 μM nocodazole for 1 h (A) or H2O or 1 mM or 0.5 mM methyl-β-cyclodextrin for 30 min (B) and then exposed to Sst-RBS or WT MLV maintaining drug or vehicle. Data represent the means ± SD for three independent experiments (n = 4). (C) Sst-RBS MLV or WT MLV was spinoculated onto 293, SSTR-expressing, or NIH 3T3 cells at 4°C and shifted to 37°C for the indicated time, and then noninternalized virus was inactivated and infection was measured after 48 h. Values shown are the relative infection, calculated as follows: (infection at each time point/infection at 1 h) × 100. The relative rate of internalization (% pseudovirions internalized per minute) was calculated as the slope of each curve using nonlinear regression analysis (GraphPad Prism). T50, time required to obtain 50% infection. Data represent the means ± SD for four independent experiments (n = 4). P values were calculated by using two-way ANOVA and the Bonferroni posttest. *, P ≤ 0.05; **, P ≤ 0.01.
Fig 5
Fig 5
SSTR-5 directs virus to a more permissive environment. 293, 293/SSTR-2, -3, and -5, or NIH 3T3 cells were pretreated with DMSO or 10 nM, 20 nM, or 30 nM BafA (A), H2O or 15 μM or 30 μM Chlor (B), DMSO or 5 μM or 25 μM CA074 Me (C), or H2O or 30 μg/ml or 100 μg/ml leupeptin (D) prior to Sst-RBS, VSV G, or WT MLV exposure, as indicated, while maintaining the drug or vehicle. Infection of control 293 cells increased to 14 TU/ml at 10 nM BafA, and there was no observable infection of 293 cells in the presence or absence of chloroquine, CA074 Me, or leupeptin. All data represent the means ± SD for at least three independent experiments (n = 4). P values were calculated by using two-way ANOVA and the Bonferroni posttest. *, P ≤ 0.05; **, P ≤ 0.01.
Fig 6
Fig 6
Penetration into the host cytoplasm is more efficient via SSTR-5. Whole-cell DNA was isolated from 293, SSTR-expressing, and NIH 3T3 cells exposed to Sst-RBS, WT MLV, or no virus as described for Fig. 3C, except that two sets of DNAs were isolated, one from cells incubated with virus at 4°C but not shifted to 37°C (zero time point) and the other isolated from replicate cell cultures 6 h after shifting to 37°C to allow time for virus to internalize, membrane fusion to occur, and viral nucleocapsid penetration of the host cell cytoplasm (6-h time point). Results obtained from the MSS and lacZ amplicons were normalized to the β-actin signal for the respective host cell line, and the fold increase in the level of reverse transcription was calculated as a measure of virion penetration by comparing lacZ gene amplification to the MSS amplification signal over the 6-h time period. No amplification was detected in mock-infected cells. Each symbol represents the relative fold increase in pseudovirion penetration from one independent experiment. The mean relative fold increase from six independent experiments is shown below the graph (n = 3). P values were calculated using one-way ANOVA and Dunn's posttest. **, P ≤ 0.01.
Fig 7
Fig 7
Model of the influence of intracellular destination on infection. Thick arrows indicate that comparable amounts of Sst-RBS pseudotyped virus are internalized by each SSTR subtype. Thin arrows indicate that a large percentage of virions complete penetration, reverse transcription, and integration when internalized via SSTR-5. Dashed arrows indicate that a relatively small percentage of virions internalized via SSTR-2 and -3 complete critical late steps of entry into the host cell cytoplasm for infection. The infection characteristics observed for cells expressing each SSTR subtype are listed next to the diagram of its entry pathway.

Similar articles

Cited by

References

    1. Coffin JM, Hughes SH, Varmus HE. 1997. Retroviruses. Cold Spring Harbor Laboratory Press, Plainview, NY - PubMed
    1. Harrison SC. 2008. Viral membrane fusion. Nat. Struct. Mol. Biol. 15:690–698 - PMC - PubMed
    1. Anderson JL, Hope TJ. 2005. Intracellular trafficking of retroviral vectors: obstacles and advances. Gene Ther. 12:1667–1678 - PubMed
    1. Goff SP. 2007. Host factors exploited by retroviruses. Nat. Rev. Microbiol. 5:253–263 - PubMed
    1. Cote M, Misasi J, Ren T, Bruchez A, Lee K, Filone CM, Hensley L, Li Q, Ory D, Chandran K, Cunningham J. 2011. Small molecule inhibitors reveal Niemann-Pick C1 is essential for Ebola virus infection. Nature 477:344–348 - PMC - PubMed

Publication types

MeSH terms