. 2013 Apr 9;110(15):E1361-70.
doi: 10.1073/pnas.1220723110. Epub 2013 Mar 20.

Integrin-dependent force transmission to the extracellular matrix by α-actinin triggers adhesion maturation

Affiliations

Integrin-dependent force transmission to the extracellular matrix by α-actinin triggers adhesion maturation

Pere Roca-Cusachs et al. Proc Natl Acad Sci U S A. .

Abstract

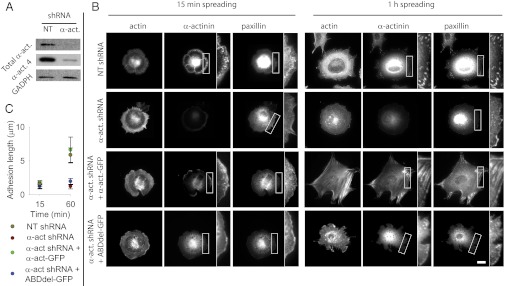
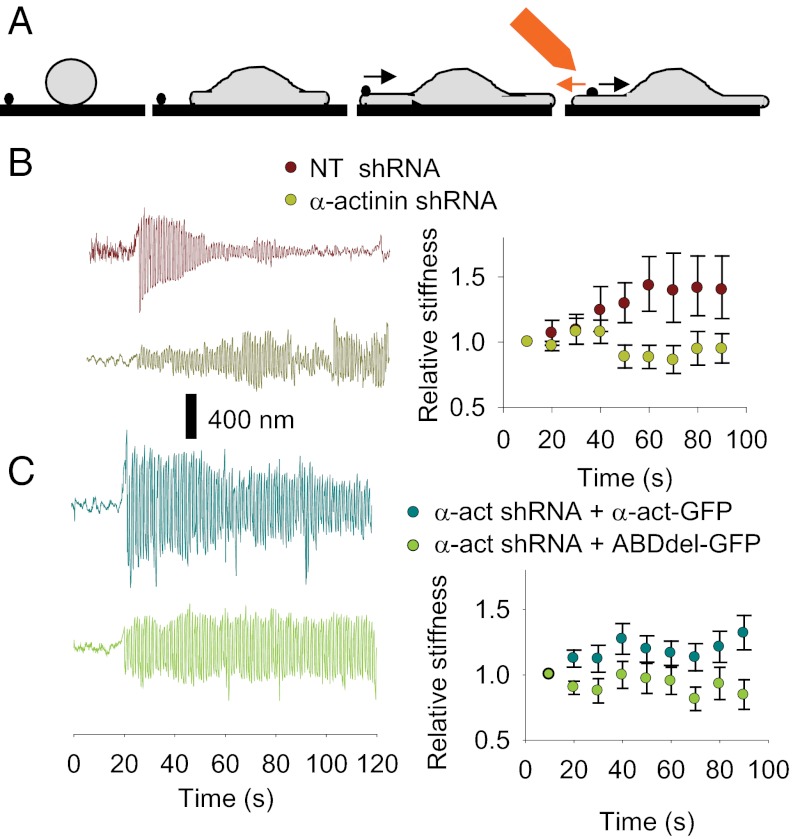
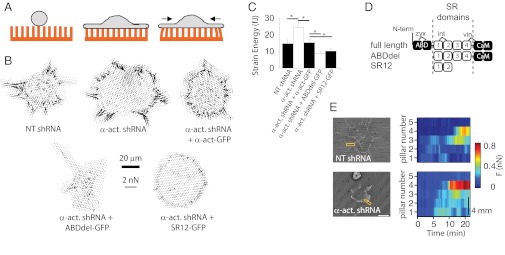
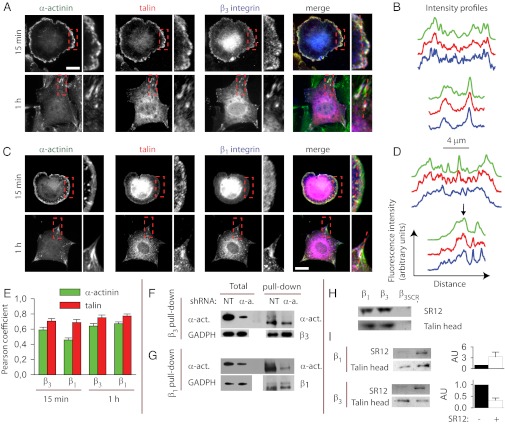
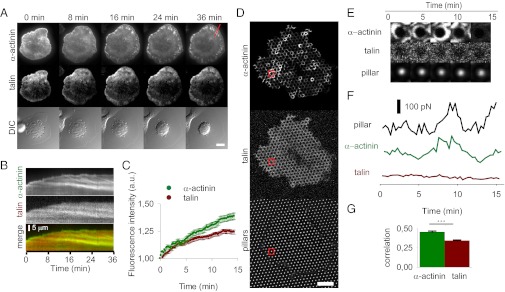
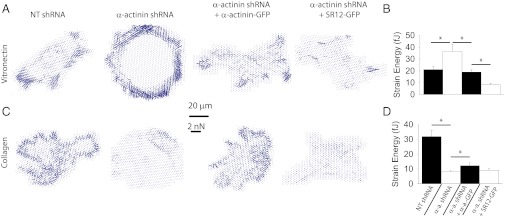
Focal adhesions are mechanosensitive elements that enable mechanical communication between cells and the extracellular matrix. Here, we demonstrate a major mechanosensitive pathway in which α-actinin triggers adhesion maturation by linking integrins to actin in nascent adhesions. We show that depletion of the focal adhesion protein α-actinin enhances force generation in initial adhesions on fibronectin, but impairs mechanotransduction in a subsequent step, preventing adhesion maturation. Expression of an α-actinin fragment containing the integrin binding domain, however, dramatically reduces force generation in depleted cells. This behavior can be explained by a competition between talin (which mediates initial adhesion and force generation) and α-actinin for integrin binding. Indeed, we show in an in vitro assay that talin and α-actinin compete for binding to β3 integrins, but cooperate in binding to β1 integrins. Consistently, we find opposite effects of α-actinin depletion and expression of mutants on substrates that bind β3 integrins (fibronectin and vitronectin) versus substrates that only bind β1 integrins (collagen). We thus suggest that nascent adhesions composed of β3 integrins are initially linked to the actin cytoskeleton by talin, and then α-actinin competes with talin to bind β3 integrins. Force transmitted through α-actinin then triggers adhesion maturation. Once adhesions have matured, α-actinin recruitment correlates with force generation, suggesting that α-actinin is the main link transmitting force between integrins and the cytoskeleton in mature adhesions. Such a multistep process enables cells to adjust forces on matrices, unveiling a role of α-actinin that is different from its well-studied function as an actin cross-linker.


Conflict of interest statement

The authors declare no conflict of interest.

Figures

Fig. 1.
Fig. 1.
Binding of α-actinin to actin enables adhesion maturation. (A) Western blot showing levels of total α-actinin and α-actinin 4 in cells transfected with a shRNA with a NT or α-actinin 4 targeting (α-act) sequence. (B) Cells transfected with NT or α-actinin shRNA and rescued with FL or ABDdel α-actinin-GFP stained after 15 min or 1 h for F-actin, α-actinin, and paxillin. In rescue cells, α-actinin image is the corresponding GFP construct. Expanded views amplify the areas marked with a white rectangle. (Scale bar, 20 µm.) (C) Quantification of paxillin adhesion length for the different conditions at the 15-min and 1-h time points. Both NT-transfected cells and α-actinin depleted cells rescued with FL α-actinin-GFP experienced significant increases in adhesion size with time (P < 0.01), whereas α-actinin depleted cells either not rescued or rescued with ABDdel-GFP did not (n ≥ 6 cells measured on 2 different days).
Fig. 2.
Fig. 2.
Force transmitted through α-actinin triggers adhesion maturation and mechanosensing. (A) Magnetic tweezers assay (from left to right). Fibronectin-coated 3-µm magnetic beads are deposited on a substrate where cells are allowed to spread. As the cells spread, they contact and adhere to the beads, and start transporting them with the rearward moving actin cytoskeleton (black arrow). At this point, a magnetic tip is placed close to the bead and a 1-nN force pulsating at 1 Hz is applied (orange arrow). The pulsation of the bead in response to the force is then monitored. (B) Example bead traces (Left) and average relative stiffness (Right) as a function of time of fibronectin-coated beads submitted to a 1-nN force pulsating at 1 Hz attached to cells transfected with NT or α-actinin shRNA. The sample traces show the oscillation of the beads as a function of time in response to the applied force (which begins at the 20-s time point). Relative stiffness values represent bead stiffness (applied force/observed movement) normalized by initial stiffness. Thus, a constant value of 1 would indicate that stiffness is constant (no reinforcement), whereas values higher than one indicate reinforcement (reduced bead pulsation) from initial movement. (C) Example bead traces and average relative stiffness for cells transfected with α-actinin shRNA and rescued with FL or ABDdel α-actinin-GFP. (P < 0.05 for both B and C, n ≥ 26 beads from ≥ 11 cells measured on 2 different days).
Fig. 3.
Fig. 3.
α-actinin mediates force generation and release through interaction with integrins. (A) Flexible pillar assay (from left to right). Cells are deposited on an array of fibronectin-coated flexible poly(dimethylsiloxane) pillars of 1-µm diameter. As the cells spread, they attach and exert contractile forces (black arrows), deflecting the pillars in proportion to the applied force. (B) Vector plots with arrows depicting the magnitude and direction of forces exerted on 1-µm pillar arrays. Cells were transfected with either NT or α-actinin shRNA and rescued with FL, ABDdel, or SR12 α-actinin-GFP. (Scale bar, 20 µm; force scale bar indicates the length of a force arrow of 2 nN.) (C) Corresponding quantification of average forces (strain energy) exerted by cells. *P < 0.05, n ≥ 14 cells measured on ≥ 2 different days. (D) Diagram of α-actinin constructs used showing the ABD, SR1–SR4, and calmodulin-like domain (CaM). Approximate binding domains to integrin-β talis (int), zyxin (zyx), and vinculin (vin) are shown. GFP was at the C terminus. (E, Left) Examples of cells on pillars transfected with NT or α-actinin shRNA. (Scale bar, 20 μm.) (Right) Forces as a function of time exerted by the row of pillars marked in yellow in the left image (see also Movies S3 and S4). Each horizontal color sequence represents an individual pillar, with the lowest pillar number being closest to the cell center.
Fig. 4.
Fig. 4.
α-Actinin and talin compete for binding to β3 integrins. (A) Localization of α-actinin, talin, and β3 integrins in cells spread for 15 min or 1 h. Merged images show α-actinin in green, talin in red, and integrins in blue. White areas denote colocalization of all three proteins. Expanded views amplify the areas marked with a red rectangle. (B) fluorescence intensity profiles (arbitrary units) across the red dotted lines shown in the corresponding zoomed view. Profiles of α-actinin, talin, and β3 integrins are shown respectively in green, red, and blue. (C and D) Same as A and B with β1 instead of β3 integrins. (Scale bars in A and C, 20 µm.) Colocalization of β1 integrins with talin and α-actinin was not clearly observable after 15 min. After 1 h, colocalization was clear for large focal adhesions (black arrow in D) but not for smaller adhesions (peaks to the right of black arrow). (E) Pearson coefficients quantifying the colocalization between talin and α-actinin to β3 and β1 integrins in staining images (1 = perfect overlap, 0 = unrelated distributions). Colocalizations with integrins were higher for talin than α-actinin (P < 0.001). For α-actinin, colocalization at 15-min spreading with β1 integrins was significantly lower than at 1 h (P < 0.01). n ≥ 6 cells measured on two diferent days. (F and G) Pull-down with β3 antibody (F) or β1 antibody (G) of lysates from cells transfected with NT or α-actinin shRNA. Lanes labeled as total show the lysate before pull-down (8× dilution), whereas lanes labeled as pull-down show the pulled-down proteins. (H) Talin head and α-actinin SR12 fragment were incubated with beads coated with β1, β3, and scrambled β33SCR) integrin cytoplasmic tails. The amount of talin head and SR12 (1 μM) bound to integrins was then assessed by protein staining after a pull-down assay. (I) Talin head (1 μM) was incubated with beads coated with β1 or β3 tails (Upper and Lower, respectively) either in the absence or in the presence (5 μM) of SR12. Amounts of talin head and SR12 were then assessed as in (H). Quantifications (to the right of each blot) show the average amounts of talin head in arbitrary units (AU), where the value for the case with no SR12 (−) is set to 1 (n ≥ 3).
Fig. 5.
Fig. 5.
Dynamics of talin and α-actinin. (A) Time sequence of cells cotransfected with α-actinin-GFP and talin-mCherry. DIC, differential interference contrast. (Scale bar, 20 µm.) (See also Movie S5). (B) Kymograph corresponding to red line in A showing the formation of α-actinin and talin adhesions (green and red, respectively, in merged image) as a function of time. (C) Quantification of relative increase in talin and α-actinin fluorescence with maturation. The fluorescence of both molecules was arbitrarily set to 1 at the beginning of the measurement. Differences were significant (n = 87 adhesions in four cells measured on 2 different days, P < 0.001). (D) Confocal image showing a cell transfected with α-actinin-GFP and talin-mCherry plated on a 1-µm pillar array. Fluorescence GFP and mCherry images and bright-field pillar image are shown. (Scale bar, 10 µm.) (See also Movie S6). (E) Time sequence of GFP and mCherry fluorescence intensity and pillar position corresponding to the pillar marked in red in D. (F) Corresponding traces of pillar force, GFP, and mCherry fluorescence. Fluorescence intensity is in arbitrary units. (G) Average correlation between α-actinin and force traces (green) and between talin and force traces (red). A correlation of 1 would indicate that both traces follow the exact same trend, and a correlation of 0 would indicate two completely unrelated traces. n = 110 pillars from three cells measured on 2 different days, ***P < 0.001.
Fig. 6.
Fig. 6.
Role of α-actinin in cell contractility depends on matrix coating. (A) Vector plots with arrows depicting the magnitude and direction of forces exerted on 1-µm pillar arrays coated with vitronectin. Cells were transfected with either NT or α-actinin shRNA and rescued with FL or SR12 α-actinin-GFP. (Scale bar, 20 µm; force scale bar indicates the length of a force arrow of 2 nN.) (B) Corresponding quantification of average forces (strain energy) exerted by cells. (C and D) Same results on collagen I-coated pillars. *P < 0.05, n ≥ 11 cells measured on 2 different days.

References

    1. Paszek MJ, et al. Tensional homeostasis and the malignant phenotype. Cancer Cell. 2005;8(3):241–254. - PubMed
    1. Mammoto T, Ingber DE. Mechanical control of tissue and organ development. Development. 2010;137(9):1407–1420. - PMC - PubMed
    1. Riveline D, et al. Focal contacts as mechanosensors: Externally applied local mechanical force induces growth of focal contacts by an mDia1-dependent and ROCK-independent mechanism. J Cell Biol. 2001;153(6):1175–1186. - PMC - PubMed
    1. Cai YF, Sheetz MP. Force propagation across cells: Mechanical coherence of dynamic cytoskeletons. Curr Opin Cell Biol. 2009;21(1):47–50. - PMC - PubMed
    1. Vicente-Manzanares M, Zareno J, Whitmore L, Choi CK, Horwitz AF. Regulation of protrusion, adhesion dynamics, and polarity by myosins IIA and IIB in migrating cells. J Cell Biol. 2007;176(5):573–580. - PMC - PubMed

Publication types

LinkOut - more resources