. 2013 Apr 2;110(14):5357-62.
doi: 10.1073/pnas.1208622110. Epub 2013 Mar 20.

Proterozoic ocean redox and biogeochemical stasis

Affiliations

Proterozoic ocean redox and biogeochemical stasis

Christopher T Reinhard et al. Proc Natl Acad Sci U S A. .

Abstract

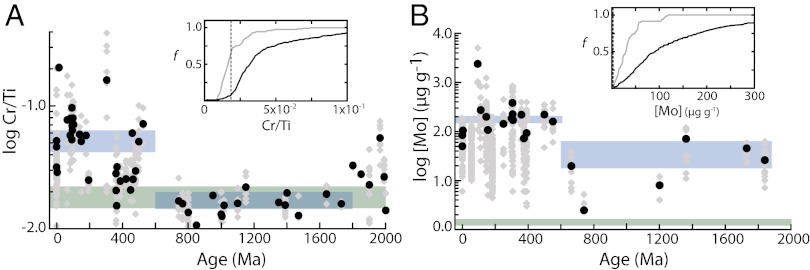
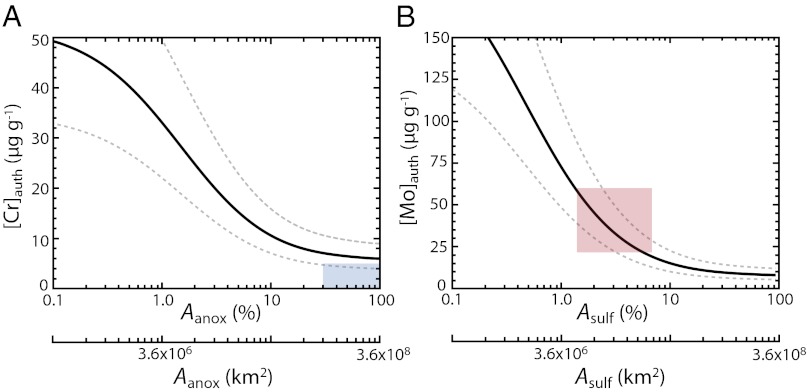
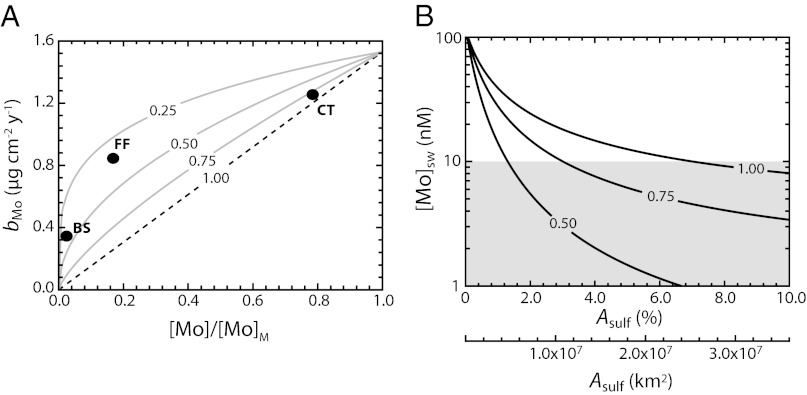
The partial pressure of oxygen in Earth's atmosphere has increased dramatically through time, and this increase is thought to have occurred in two rapid steps at both ends of the Proterozoic Eon (∼2.5-0.543 Ga). However, the trajectory and mechanisms of Earth's oxygenation are still poorly constrained, and little is known regarding attendant changes in ocean ventilation and seafloor redox. We have a particularly poor understanding of ocean chemistry during the mid-Proterozoic (∼1.8-0.8 Ga). Given the coupling between redox-sensitive trace element cycles and planktonic productivity, various models for mid-Proterozoic ocean chemistry imply different effects on the biogeochemical cycling of major and trace nutrients, with potential ecological constraints on emerging eukaryotic life. Here, we exploit the differing redox behavior of molybdenum and chromium to provide constraints on seafloor redox evolution by coupling a large database of sedimentary metal enrichments to a mass balance model that includes spatially variant metal burial rates. We find that the metal enrichment record implies a Proterozoic deep ocean characterized by pervasive anoxia relative to the Phanerozoic (at least ∼30-40% of modern seafloor area) but a relatively small extent of euxinic (anoxic and sulfidic) seafloor (less than ∼1-10% of modern seafloor area). Our model suggests that the oceanic Mo reservoir is extremely sensitive to perturbations in the extent of sulfidic seafloor and that the record of Mo and chromium enrichments through time is consistent with the possibility of a Mo-N colimited marine biosphere during many periods of Earth's history.


Conflict of interest statement

The authors declare no conflict of interest.

Figures

Fig. 1.
Fig. 1.
Sedimentary Cr (A) and Mo (B) enrichments in anoxic and euxinic black shales through time. Because of the relatively high Cr content of typical detrital material, Cr enrichments are expressed as Cr/Ti ratios. Gray diamonds represent all filtered data, whereas black circles represent temporally binned averages. Blue boxes show the total mean (±95% confidence interval) of temporally binned averages for the mid-Proterozoic and Phanerozoic (SI Discussion). (Insets) Cumulative frequency distribution of enrichments for the mid-Proterozoic (gray curve) and the Phanerozoic (black curve). Green boxes show the composition of average post-Archean upper crust (–33) used to approximate the detrital input. Note the log scale.
Fig. 2.
Fig. 2.
Estimated authigenic sedimentary enrichments ([X]auth) for Cr (A) and Mo (B) in a generalized anoxic or euxinic setting, respectively, as a function of anoxic and sulfidic seafloor area (Aanox, Asulf). Black curves represent a bulk mass accumulation rate of 1.0 × 10⁻² g⋅cm−2⋅y−1, whereas gray dotted curves represent a factor of 1.5 above and below this value (SI Discussion; Fig. S5). The blue box in A represents the approximate area of seafloor anoxia required to drop below an enrichment threshold of 5 µg⋅g−1, a conservative value for our purposes given the negligible enrichments recorded by mid-Proterozoic anoxic shales. The red box in B shows the approximate sulfidic seafloor area consistent with the range of mid-Proterozoic Mo enrichments, and is scaled relative to the y axis according to the 95% confidence interval of temporally binned averages shown in Fig. 1. Seafloor areas are shown as a percentage relative to modern seafloor area (%) and in terms of raw area (km2).
Fig. 3.
Fig. 3.
Effects of deviating from a strictly first-order model. (A) Mo burial rates as a function of ambient dissolved Mo concentration (shown as a proportion of modern seawater [Mo]/[Mo]M) for a range of α-values between 1.0 (strict first-order) and 0.25. Curves are calculated assuming a modern globally averaged euxinic burial rate of 1.53 µg⋅cm−2⋅y−1. Black circles represent values for well-characterized perennially euxinic marine basins on the modern Earth [Black Sea (BS), Framvaren Fjord (FF), and the Cariaco Trench (CT)]. (B) Steady-state globally averaged seawater Mo concentrations as a function of sulfidic seafloor area (Asulf) for different values of α. The shaded box depicts values below 10 nM.

References

    1. Holland HD. The Chemical Evolution of the Atmosphere and Oceans. Princeton: Princeton Univ Press; 1984.
    1. Cloud P. A working model of the primitive Earth. Am J Sci. 1972;272(6):537–548.
    1. Payne JL, et al. Two-phase increase in the maximum size of life over 3.5 billion years reflects biological innovation and environmental opportunity. Proc Natl Acad Sci USA. 2009;106(1):24–27. - PMC - PubMed
    1. Canfield DE. A new model for Proterozoic ocean chemistry. Nature. 1998;396(6692):450–453.
    1. Shen Y, Canfield DE, Knoll AH. Middle Proterozoic ocean chemistry: Evidence from the McArthur Basin, Northern Australia. Am J Sci. 2002;302(2):81–109.

Publication types