

Abdominal fat is associated with lower bone formation and inferior bone quality in healthy premenopausal women: a transiliac bone biopsy study
- PMID: 23515452
- PMCID: PMC3667251
- DOI: 10.1210/jc.2013-1047
Abdominal fat is associated with lower bone formation and inferior bone quality in healthy premenopausal women: a transiliac bone biopsy study
Abstract
Context: The conventional view that obesity is beneficial for bone strength has recently been challenged by studies that link obesity, particularly visceral obesity, to low bone mass and fractures. It is controversial whether effects of obesity on bone are mediated by increased bone resorption or decreased bone formation.
Objective: The objective of the study was to evaluate bone microarchitecture and remodeling in healthy premenopausal women of varying weights.
Design: We measured bone density and trunk fat by dual-energy x-ray absorptiometry in 40 women and by computed tomography in a subset. Bone microarchitecture, stiffness, remodeling, and marrow fat were assessed in labeled transiliac bone biopsies.
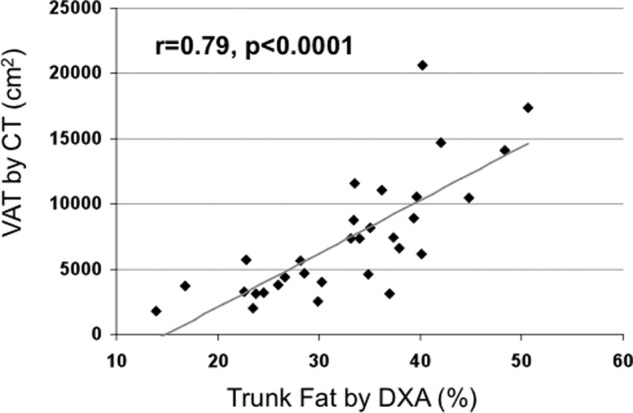
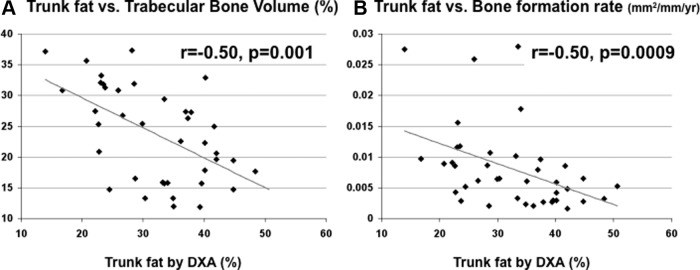
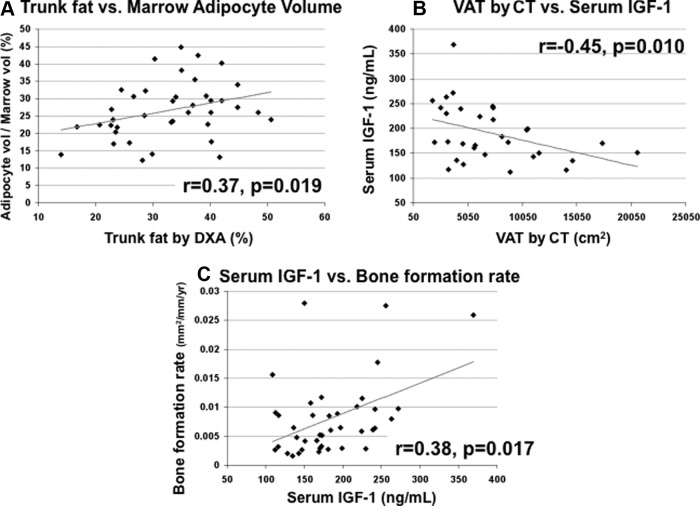
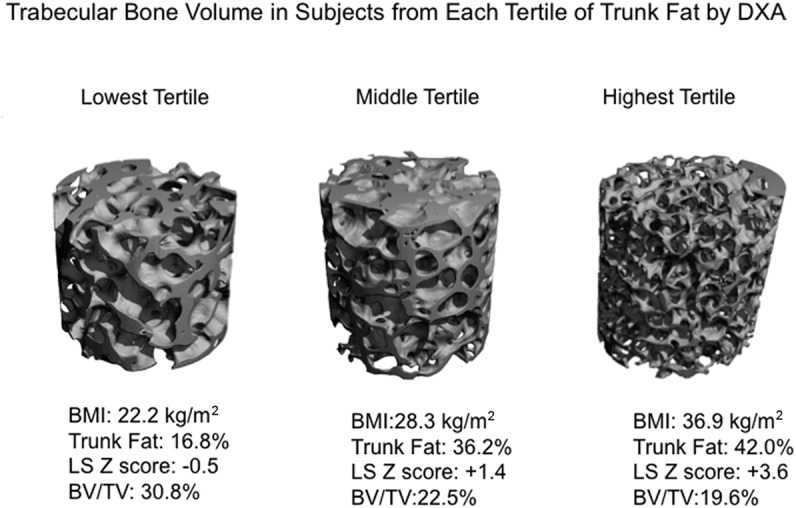
Results: Body mass index (BMI) ranged from 20.1 to 39.2 kg/m(2). Dual-energy x-ray absorptiometry-trunk fat was directly associated with BMI (r = 0.78, P < .001) and visceral fat by computed tomography (r = 0.79, P < .001). Compared with women in the lowest tertile of trunk fat, those in the highest tertile had inferior bone quality: lower trabecular bone volume (20.4 ± 5.8 vs 29.1 ± 6.1%; P = .001) and stiffness (433 ± 264 vs 782 ± 349 MPa; P = .01) and higher cortical porosity (8.8 ± 3.5 vs 6.3 ± 2.4%; P = .049). Bone formation rate (0.004 ± 0.002 vs 0.011 ± 0.008 mm(2)/mm · year; P = .006) was 64% lower in the highest tertile. Trunk fat was inversely associated with trabecular bone volume (r = -0.50; P < .01) and bone formation rate (r = -0.50; P < .001). The relationship between trunk fat and bone volume remained significant after controlling for age and BMI.
Conclusions: At the tissue level, premenopausal women with more central adiposity had inferior bone quality and stiffness and markedly lower bone formation. Given the rising levels of obesity, these observations require further investigation.
Figures
References
-
- Flegal KM, Carroll MD, Kit BK, Ogden CL. Prevalence of obesity and trends in the distribution of body mass index among US adults, 1999–2010. JAMA. 2012;307:491–497 - PubMed
-
- Nejat EJ, Polotsky AJ, Pal L. Predictors of chronic disease at midlife and beyond—the health risks of obesity. Maturitas. 65:106–111 - PubMed
-
- Klein KO, Larmore KA, de Lancey E, Brown JM, Considine RV, Hassink SG. Effect of obesity on estradiol level, and its relationship to leptin, bone maturation, and bone mineral density in children. J Clin Endocrinol Metab. 1998;83:3469–3475 - PubMed
-
- Reid IR, Plank LD, Evans MC. Fat mass is an important determinant of whole body bone density in premenopausal women but not in men. J Clin Endocrinol Metab. 1992;75:779–782 - PubMed
-
- Albala C, Yanez M, Devoto E, Sostin C, Zeballos L, Santos JL. Obesity as a protective factor for postmenopausal osteoporosis. Int J Obes Relat Metab Disord. 1996;20:1027–1032 - PubMed
Publication types
MeSH terms
Substances
Grants and funding
LinkOut - more resources
Full Text Sources
Other Literature Sources
Medical
