. 2013 Mar 18:7:13.
doi: 10.3389/fncom.2013.00013. eCollection 2013.

The energy cost of action potential propagation in dopamine neurons: clues to susceptibility in Parkinson's disease

Affiliations

The energy cost of action potential propagation in dopamine neurons: clues to susceptibility in Parkinson's disease

Eleftheria K Pissadaki et al. Front Comput Neurosci. .

Abstract

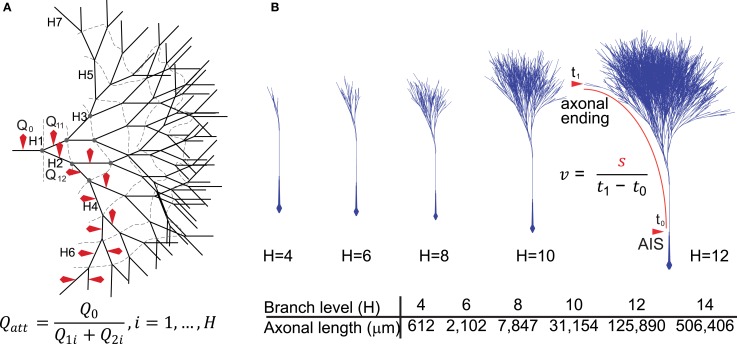
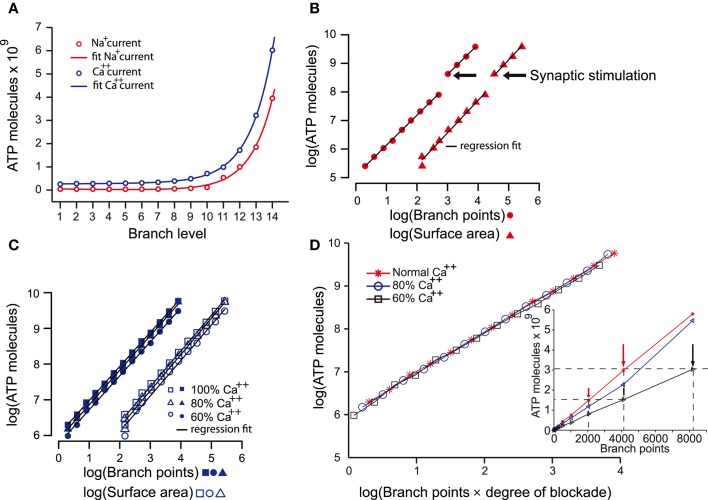
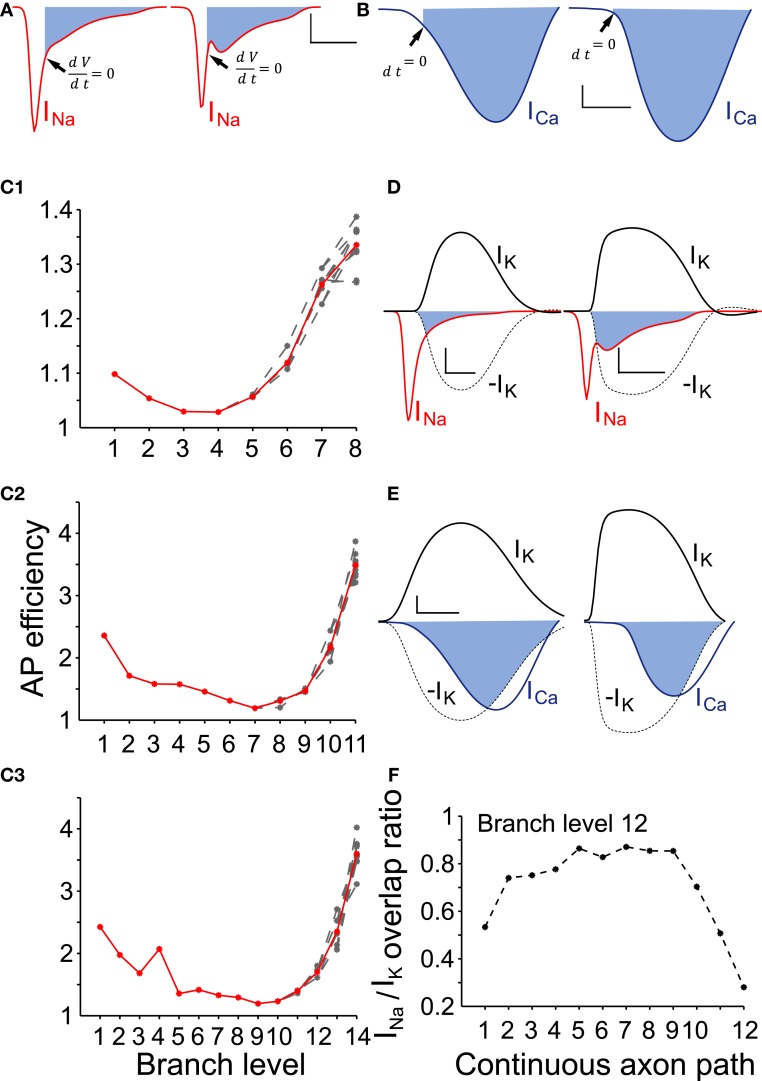
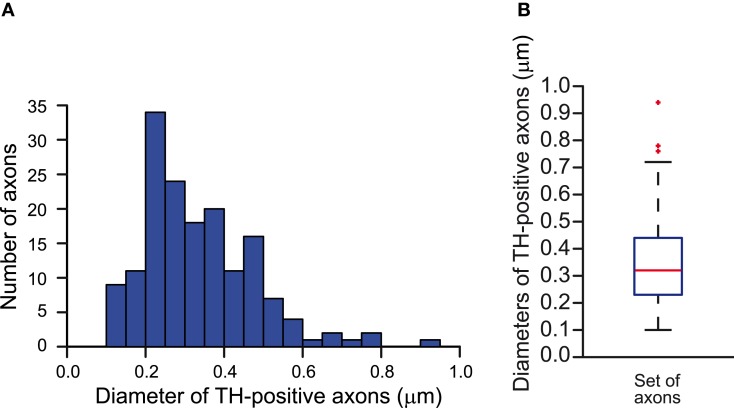
Dopamine neurons of the substantia nigra pars compacta (SNc) are uniquely sensitive to degeneration in Parkinson's disease (PD) and its models. Although a variety of molecular characteristics have been proposed to underlie this sensitivity, one possible contributory factor is their massive, unmyelinated axonal arbor that is orders of magnitude larger than other neuronal types. We suggest that this puts them under such a high energy demand that any stressor that perturbs energy production leads to energy demand exceeding supply and subsequent cell death. One prediction of this hypothesis is that those dopamine neurons that are selectively vulnerable in PD will have a higher energy cost than those that are less vulnerable. We show here, through the use of a biology-based computational model of the axons of individual dopamine neurons, that the energy cost of axon potential propagation and recovery of the membrane potential increases with the size and complexity of the axonal arbor according to a power law. Thus SNc dopamine neurons, particularly in humans, whose axons we estimate to give rise to more than 1 million synapses and have a total length exceeding 4 m, are at a distinct disadvantage with respect to energy balance which may be a factor in their selective vulnerability in PD.

Keywords: Parkinson's disease; axons; dopamine; energy metabolism; neurodegeneration; nigrostriatal pathway; unmyelinated.


Figures

Figure 1
Figure 1
Diagrammatic representation of the model neurons. (A) Two-dimensional representation of the model axon based on the structure of a full binary tree. The branching level is represented by H1–7 (dashed lines represent branch contours or levels) and red markers indicate the axonal branches from where sodium charge (Qx) was sampled and used to derive charge attenuation (Qatt) according to the formula. (B) A three-dimensional representation of the axonal binary tree for neurons with 4–12 levels of branching (H4–H12). For neurons with 14 levels of branches (H = 14), the total axonal length was about 50 cm, possessing 16,384 branches, 8191 nodes and 8192 axonal endings. We included in the models an axonal segment of ~6 mm representing the connection between the axon initial segment in the substantia nigra and the beginning of the arborization in the striatum. Conduction velocity (v) was calculated using the formula in which s represents the length of the axonal path from the axon initial segment to an axonal ending and t1t0 represents the time taken for the propagation of the action potential along that path.
Figure 2
Figure 2
Validation of the biophysical characteristics of the model. (A1) Voltage waveform (black trace) during spontaneous activity of a dissociated SNc dopamine neuron. The red trace illustrates the sodium current (TTX-sensitive) and the blue trace illustrates the calcium (Co++-sensitive) current (reprinted from Puopolo et al., 2007). (A2) Voltage recording from the soma of the model (black trace). Half height action potential duration is about 1 ms. The contributions of sodium (red trace) and calcium (blue trace) currents are similar to the experimental data in (A1). The longer timescale in (A1) is because recordings were made at 22°C and possibly a consequence of the dissociation of the neurons. (B1) Depolarizing current injection (lower trace) into an SNc dopamine neuron (in vitro slice recording) blocks spontaneous activity which then returns to baseline firing after the termination of the current injection (reprinted from Blythe et al., 2009). (B2) Depolarizing current injection (lower trace) in the model neuron blocks the firing of action potentials (see timescale-expanded region in the red inset) which returns to baseline firing within 500 ms. (C1) In response to hyperpolarizing current injection (lower trace) dopamine neurons respond with a hyperpolarization and the characteristic hyperpolarization sag mediated by h-current, followed by a short rebound delay (in vitro slice recording; reprinted from Blythe et al., 2009). (C2) Negative current injection into the model neuron (lower trace) leads to a similar hyperpolarization, hyperpolarization sag, and short rebound delay (see timescale-expanded region in the red inset indicated by red arrowhead). (D1) Intracellular recording during burst firing of a dopamine neuron in vivo (reprinted from Grace and Bunney, 1984a). (D2) Application of synaptic stimulation at the soma of the model neuron (red arrowhead) leads to burst firing with progressively reduced spike amplitude.
Figure 3
Figure 3
Signal propagation throughout the axonal tree of the dopamine neuron model. (A) Propagation of an action potential initiated at the axon initial segment (0 μm) along a path in the model neuron, represented as plots of voltage against distance. (A1) The action potentials reliably propagated to the axonal endings (A2,A3) and antidromically toward the soma. Note that 6223 μm represents the longest path through the axonal tree of a neuron with six levels of branching. (B1) Conductance velocity ranged from 0.45 to 0.55 m/s. For an axonal arborization with eight levels of branching, the time taken for an action potential to propagate from its point of initiation at the axon initial segment (black trace) to the axonal endings (red traces) was ~15 ms. As action potentials invaded the arborization within the striatum, their width progressively decreased and amplitude progressively increased (red traces; changing red color indicates recordings further along the axonal path). (B2) Synaptic stimulation facilitated action potential invasion into the higher order parts of the axonal arborization. Failure of propagation or inadequate conductance velocity of the pacemaking firing pattern (small arrowhead) was overcome by somatic synaptic stimulation (large arrowhead). Black trace: Voltage recording from the axon initial segment. Red trace: Voltage recording from an axonal ending. (C) The effect of branching on charge attenuation (Qatt; see Figure 1A) for a small (6 levels of branching) and a large (13 levels of branching) model neuron in (C1) and (C2), respectively. In both cases energy loss takes place to a greater degree in the distal and terminal branches of the arborization. Red trace is the mean, gray traces represent Qatt in different paths through the arborization.
Figure 4
Figure 4
The energy cost of the propagation of action potentials in the dopamine neuron models. (A) Estimates of the energy cost of the propagation of action potentials throughout axonal arborizations of neurons with 1–14 levels of branching expressed as number of ATP molecules consumed. ATP molecules are consumed as a consequence of the movement of sodium ions (i.e., sodium current; red plot) and calcium ions (i.e., calcium current; blue plot). ATP demand increases exponentially with increasing levels of axonal branching for both ions (R2: Na+ = 0.9986; Ca++ = 0.9999). (B) A log-log plot of the number of ATP molecules consumed by the sodium current during action potential propagation against the number of branch points and the surface area of neurons with increasing levels of branching. The linear relationship of the parameters indicates that the increase in the number of ATP molecules consumed is a power law function of the number of branch points (multiple R2: Na+ = 0.9997, degrees of freedom = 10, p-value <2.2e–16) and the surface area (multiple R2: Na+ = 0.9965, degrees of freedom = 10, p-value <5.3e–16) beyond the segment connecting axon initial segment with the striatum. The discontinuity is the point at which synaptic stimulation (arrows) was required for propagation of the action potential. (C) Similar plot to that in (B) but for the calcium current. This plot shows that the increase in the number of ATP molecules consumed as a consequence of the calcium current also follows a power law relative to the two variables (except in the case of 60% Ca++; see Table 2). Reducing calcium conductance by 20% and 40% leads to the number of ATP molecules reducing by 10.5% and 26%, respectively (average values). The continuous lines in each plot are the regression fits for the data. (D) To examine how ATP is related to the reduction of the axonal network as occurs after blocking calcium channels, we plot the log of number of ATP molecules against the log of the product of number of branches and degree of calcium blockade. This reveals that the number of ATP molecules consumed is dependent on calcium and the size of the axon Blocking the calcium channels by 20% and 40% not only reduced the number of ATP molecules required for the propagation of an action potential (C). The number of ATP molecules required in 60% calcium conditions for neurons with less than 8191 branch points (black arrows) was the same as for neurons one level of branching less (i.e., 4095 branch points; red arrows) in normal calcium (inset).
Figure 5
Figure 5
AP efficiency depends on the neuron size and the axon branch level. (A) To determine the action potential efficiency we calculated the ratio of Na+ influx integrated over the duration of an action potential to Na+ influx integrated over the period from the start until the peak of the action potential. Representative sodium currents recorded from a proximal (branch level = 1) and a distal axon branch (branch level = 12) during action potential propagation in an SNc model neuron with 12 levels of branching. Filled areas represent the redundant Na+ influx following the upstroke of the action potential. Arrows indicate the time point where dV/dt = 0, i.e., peak of the action of the action potential (scale: vertical: 0.2 mA /cm2; horizontal: 500 μs). (B) Representative calcium currents recorded from the same positions in the same model neuron. Activation of calcium channels occurs immediately preceding the peak and following the peak of the action potential (black arrows). Scale: vertical: 0.1 mA /cm2; horizontal: 500 μs. (C1–C3) AP efficiency was determined for axonal branches forming continuous paths (n = 10 paths) within axonal arborizations of three different sizes (8, 11, and 14 levels of branching). Action potential efficiency of more than one is indicative of energy loss (i.e., inefficiency). For all sizes of neurons, the more distal an axon-branch is located from the soma, the less energy efficient is the action potential (above a particular threshold), suggesting that the size and complexity of the axonal abrorization is negatively correlated with energy efficiency during action potential propagation. (Red curves represent the average and gray curves the individual paths) (D) Overlapping Na+ (red trace) and K+ (black) currents for the neuron model with 12 levels of branching. Filled areas represent charge overlap. Na+/K+ charge separation takes place to a different extent whether the axon-branch is proximal (left panel) or distal (right panel) to the axon initial segment. Dashed lines are a reflection of the potassium currents to show the regions of overlap. Scales: vertical: 0.2 mA/cm2; horizontal: 500 μs. (E) Overlapping Ca++ (blue trace) and K+ (black trace) currents at the same position as in (D). Because calcium channels are mostly activated during the descending repolarization phase of the action potentials, the overlap between Ca++ and K+ currents is prominent (filled areas). Dashed lines are a reflection of the potassium currents to show the regions of overlap. Scales: vertical: 0.1 mA/cm2; horizontal: 500 μs. (F) Na+/K+ charge overlap determined in a continuous axon path of the model neuron with 12 levels of branching. Charge overlap was calculated as the ratio of the integrated non-overlapping Na+ charge integrated over the total Na+ charge during an action potential. Charge overlap ratio reaches a minimum for the axonal endings while is maximum for axon branches of moderate branch order. A ratio of less than one is indicative of less efficient action potential generation.
Figure A1
Figure A1
Estimation of the diameters of the axons of SNc dopamine neurons in the striatum of the rat. (A) Frequency distribution of the diameters of tyrosine hydroxylase-immunopositive axons measured in electron micrographs of the striatum (n = 161). (B) Whisker plot of the distribution of the diameters of tyrosine hydroxylase-positive axons. Median diameter = 0.32 μm. Red markers indicate outlier data, not included in the calculations of the minimum and maximum whiskers.
Figure A2
Figure A2
Relationship between sodium channel conductance and level of branching. Sodium channel conductance and level of branching of a neuron are positively correlated when signal propagation was constrained by the maximum conduction velocity (0.5 m/s) and the action potential magnitude exceeding membrane potential of 0 mV.
Figure A3
Figure A3
Phase plots during bursting activity. Red curves represent activity recorded from the action initial segment and black curves represent activity recorded from the soma. The first three spikes have successively reduced amplitudes and the rate of voltage change drops indicating smaller total amounts of inflowing current. Arrows indicate the number of the somatic spike in the burst depicted in the inset.
Figure A4
Figure A4
Sodium (upper panel) and calcium (lower panel) currents composing an action potential (AP). Sodium and calcium currents recorded during the propagation of an AP in a continuous path of axonal arborizations of neurons with 11 and 14 levels of branching. The first curve of each panel was recorded from the first axonal branch of the path and the second (dashed curve) from the last. Peak amplitude currents attenuate as they regenerate at the axonal endings. Also evident from the plots is the propagation latency within the axonal path.

References

    1. Aisley A. J. (2001). The Physiology of Excitable Cells. Cambridge: Cambridge University Press
    1. Alle H., Roth A., Geiger J. R. (2009). Energy-efficient action potentials in hippocampal mossy fibers. Science 325, 1405–1408 10.1126/science.1174331 - DOI - PubMed
    1. Amini B., Clark J. W., Canavier C. C. (1999). Calcium dynamics underlying pacemaker-like and burst firing oscillations in midbrain dopaminergic neurons: a computational study. J. Neurophysiol. 82, 2249–2261 - PubMed
    1. Arbuthnott G. W., Wickens J. (2007). Space, time and dopamine. Trends Neurosci. 30, 62–69 10.1016/j.tins.2006.12.003 - DOI - PubMed
    1. Attwell D., Laughlin S. B. (2001). An energy budget for signaling in the grey matter of the brain. J. Cereb. Blood Flow Metab. 21, 1133–1145 10.1097/00004647-200110000-00001 - DOI - PubMed

LinkOut - more resources