Shifting attentional priorities: control of spatial attention through hemispheric competition
- PMID: 23516306
- PMCID: PMC3651512
- DOI: 10.1523/JNEUROSCI.4089-12.2013
Shifting attentional priorities: control of spatial attention through hemispheric competition
Abstract
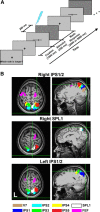
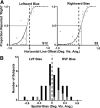
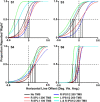
Regions of frontal and posterior parietal cortex are known to control the allocation of spatial attention across the visual field. However, the neural mechanisms underlying attentional control in the intact human brain remain unclear, with some studies supporting a hemispatial theory emphasizing a dominant function of the right hemisphere and others supporting an interhemispheric competition theory. We previously found neural evidence to support the latter account, in which topographically organized frontoparietal areas each generate a spatial bias, or "attentional weight," toward the contralateral hemifield, with the sum of the weights constituting the overall bias that can be exerted across visual space. Here, we used a multimodal approach consisting of functional magnetic resonance imaging (fMRI) of spatial attention signals, behavioral measures of spatial bias, and fMRI-guided single-pulse transcranial magnetic stimulation (TMS) to causally test this interhemispheric competition account. Across the group of fMRI subjects, we found substantial individual differences in the strengths of the frontoparietal attentional weights in each hemisphere, which predicted subjects' respective behavioral preferences when allocating spatial attention, as measured by a landmark task. Using TMS to interfere with attentional processing within specific topographic frontoparietal areas, we then demonstrated that the attentional weights of individual subjects, and thus their spatial attention behavior, could be predictably shifted toward one visual field or the other, depending on the site of interference. The results of our multimodal approach, combined with an emphasis on neural and behavioral individual differences, provide compelling evidence that spatial attention is controlled through competitive interactions between hemispheres rather than a dominant right hemisphere in the intact human brain.
Figures


Similar articles
-
Hemispheric differences in the voluntary control of spatial attention: direct evidence for a right-hemispheric dominance within frontal cortex.J Cogn Neurosci. 2013 Aug;25(8):1332-42. doi: 10.1162/jocn_a_00402. Epub 2013 Apr 11. J Cogn Neurosci. 2013. PMID: 23574586
-
Testing the inter-hemispheric competition account of visual extinction with combined TMS/fMRI.Neuropsychologia. 2015 Jul;74:63-73. doi: 10.1016/j.neuropsychologia.2015.04.021. Epub 2015 Apr 21. Neuropsychologia. 2015. PMID: 25911128
-
Mechanisms of spatial attention control in frontal and parietal cortex.J Neurosci. 2010 Jan 6;30(1):148-60. doi: 10.1523/JNEUROSCI.3862-09.2010. J Neurosci. 2010. PMID: 20053897 Free PMC article.
-
The hybrid model of attentional control: New insights into hemispheric asymmetries inferred from TMS research.Neuropsychologia. 2015 Jul;74:21-9. doi: 10.1016/j.neuropsychologia.2014.11.023. Epub 2014 Nov 20. Neuropsychologia. 2015. PMID: 25451041 Review.
-
Maps of space in human frontoparietal cortex.J Physiol Paris. 2013 Dec;107(6):510-6. doi: 10.1016/j.jphysparis.2013.04.002. Epub 2013 Apr 18. J Physiol Paris. 2013. PMID: 23603831 Free PMC article. Review.
Cited by
-
Rethinking Remapping: Circuit Mechanisms of Recovery after Stroke.J Neurosci. 2023 Nov 8;43(45):7489-7500. doi: 10.1523/JNEUROSCI.1425-23.2023. J Neurosci. 2023. PMID: 37940595 Free PMC article. Review.
-
Anticlockwise or clockwise? A dynamic Perception-Action-Laterality model for directionality bias in visuospatial functioning.Neurosci Biobehav Rev. 2016 Sep;68:669-693. doi: 10.1016/j.neubiorev.2016.06.032. Epub 2016 Jun 24. Neurosci Biobehav Rev. 2016. PMID: 27350096 Free PMC article. Review.
-
Dissociations between spatial-attentional processes within parietal cortex: insights from hybrid spatial cueing and change detection paradigms.Front Hum Neurosci. 2013 Jul 16;7:366. doi: 10.3389/fnhum.2013.00366. eCollection 2013. Front Hum Neurosci. 2013. PMID: 23882202 Free PMC article.
-
The impact of top-down spatial attention on laterality and hemispheric asymmetry in the human parietal cortex.J Vis. 2016 Aug 1;16(10):2. doi: 10.1167/16.10.2. J Vis. 2016. PMID: 27494544 Free PMC article.
-
The Effect of Mirror Visual Feedback on Spatial Neglect for Patients after Stroke: A Preliminary Randomized Controlled Trial.Brain Sci. 2022 Dec 20;13(1):3. doi: 10.3390/brainsci13010003. Brain Sci. 2022. PMID: 36671985 Free PMC article.
References
-
- Anderson B. Pieces of the true crossover effect in neglect. Neurology. 1997;49:809–812. - PubMed
-
- Axenfeld T. Hemianopische gesichtsfeldstorungen nach schadelschussen. Klin Monatsbl Augenheilkd. 1915;55:126–143.
-
- Benjamini Y, Hochberg Y. Controlling the false discovery rate: a practical approach to multiple testing. J R Stat Soc Ser B Stat Methodol. 1995;57:289–300.
-
- Bisiach E, Capitani E, Colombo A, Spinnler H. Halving a horizontal segment: a study on hemisphere-damaged patients with cerebral focal lesions. Schweiz Arch Neurol Neurochir Psychiatr. 1976;118:199–206. - PubMed
Publication types
MeSH terms
Grants and funding
LinkOut - more resources
Full Text Sources
Other Literature Sources
