

A dynamical role for acetylcholine in synaptic renormalization
- PMID: 23516342
- PMCID: PMC3597526
- DOI: 10.1371/journal.pcbi.1002939
A dynamical role for acetylcholine in synaptic renormalization
Abstract
Although sleep is a fundamental behavior observed in virtually all animal species, its functions remain unclear. One leading proposal, known as the synaptic renormalization hypothesis, suggests that sleep is necessary to counteract a global strengthening of synapses that occurs during wakefulness. Evidence for sleep-dependent synaptic downscaling (or synaptic renormalization) has been observed experimentally, but the physiological mechanisms which generate this phenomenon are unknown. In this study, we propose that changes in neuronal membrane excitability induced by acetylcholine may provide a dynamical mechanism for both wake-dependent synaptic upscaling and sleep-dependent downscaling. We show in silico that cholinergically-induced changes in network firing patterns alter overall network synaptic potentiation when synaptic strengths evolve through spike-timing dependent plasticity mechanisms. Specifically, network synaptic potentiation increases dramatically with high cholinergic concentration and decreases dramatically with low levels of acetylcholine. We demonstrate that this phenomenon is robust across variation of many different network parameters.
Conflict of interest statement
The authors have declared that no competing interests exist.
Figures
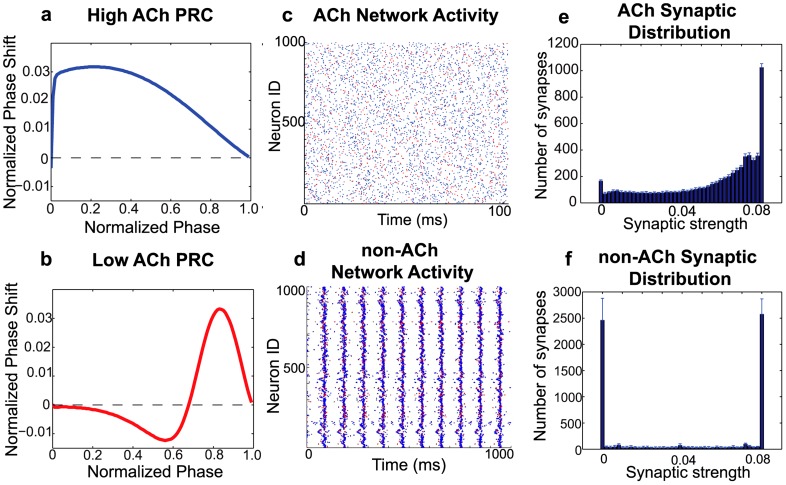
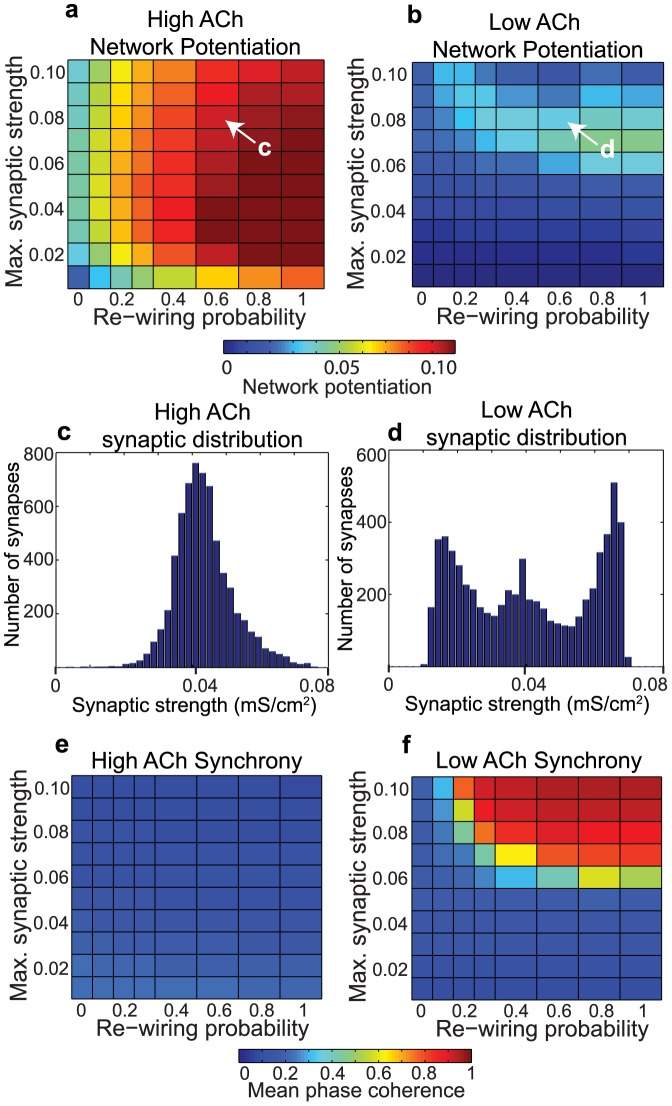
 . (f) Average final distribution of synaptic strengths for a typical low-ACh network. This distribution constitutes a much lower network potentiation value (
 ) due to a greater proportion of synapses with zero synaptic strength values. In panels (c)–(f), the re-wiring probability was 0.60 and
  . Panels (e) and (f) represent histograms averaged over ten different network initializations.
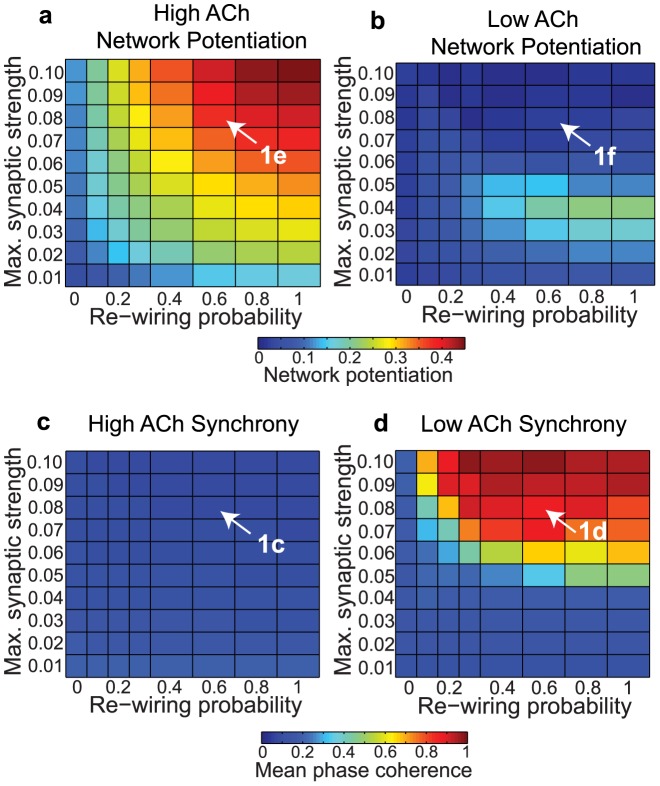
 , y-axis) for model cortical networks both with (a) high and (b) low simulated cholinergic modulation. Note the much greater potentiation of high-ACh networks for virtually all network parameters, and especially for
  . (c,d) Network synchrony, as measured by mean phase coherence, as a function of re-wiring probability and
  for networks with (c) high and (d) low simulated cholinergic modulation. All results represent averages over ten randomly-initialized network simulations. Arrows indicate network parameters which gave rise to panels c, d, e, and f in Fig. 1.
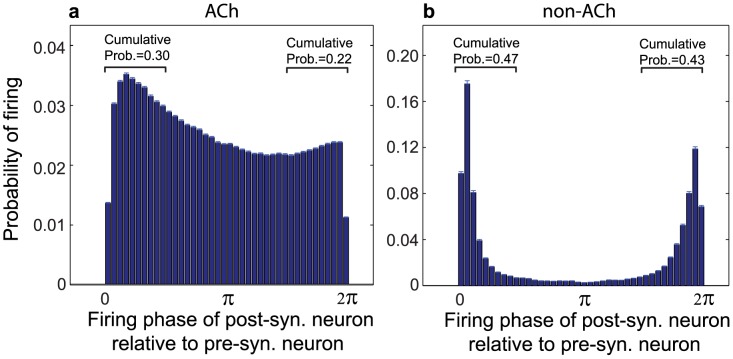
 (0.30) was substantially larger than the cumulative probability of firing within the interval
  (0.22). (b) In low-ACh networks, post-synaptic spike timings were more balanced between shortly preceding and shortly succeeding pre-synaptic spikes, leading to much lower network potentiation via the STDP rule. Both histograms were computed from simulations in which the re-wiring probability was 0.60 and
  . Note the different scales on the y-axes.
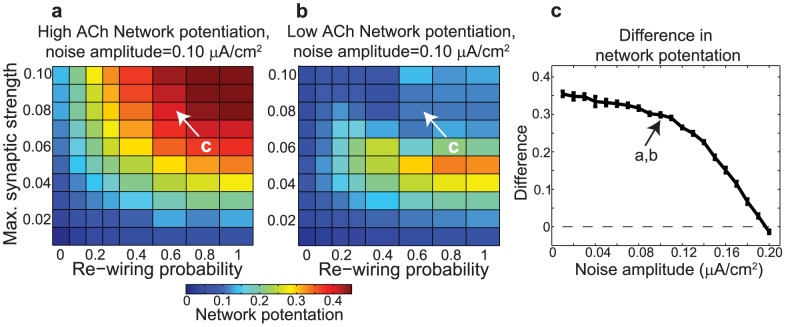
 (y-axis) for networks with (a) high and (b) low cholinergic modulation, with noise amplitude fixed at
  . Note that high-ACh networks exhibited much greater potentiation than low-ACh networks for
  . (c) Difference in network potentiation between high- and low-ACh networks as a function of noise amplitude for the network parameters indicated by arrows in panels (a) and (b).
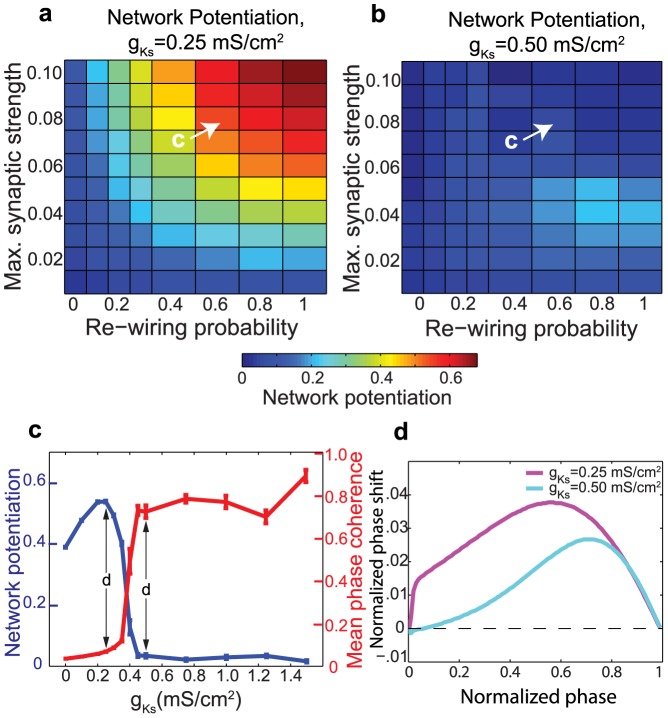
 , upon network potentiation and PRC. (a,b) Examples of network potentiation as a function of
  and re-wiring probability for
  and
and  . (c) Network potentiation and synchronization (as measured by mean phase coherence) as a function of
  for the network parameters indicated in (a) and (b). (d) Phase response curves corresponding to
  and
and  .
.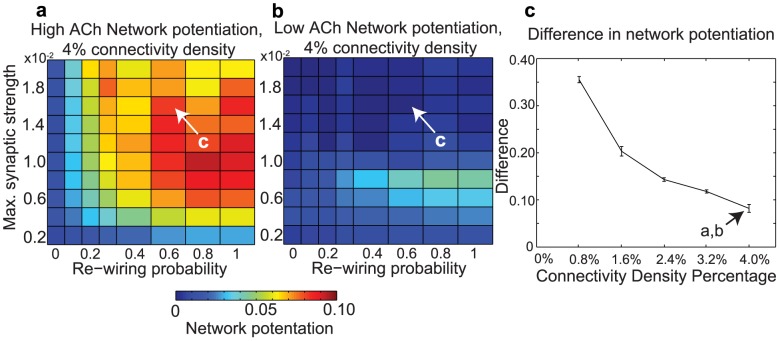
 and re-wiring probability, as in Fig. 2. Note the difference in scale between these plots and Fig. 2. (c) Difference between high-ACh and low-ACh network potentiation values as a function of connectivity density for networks with parameters analogous to those indicated by arrows in panels (a) and (b). In order to investigate similar regimes of network excitability, we decreased
  in proportion to the increase in connectivity density.
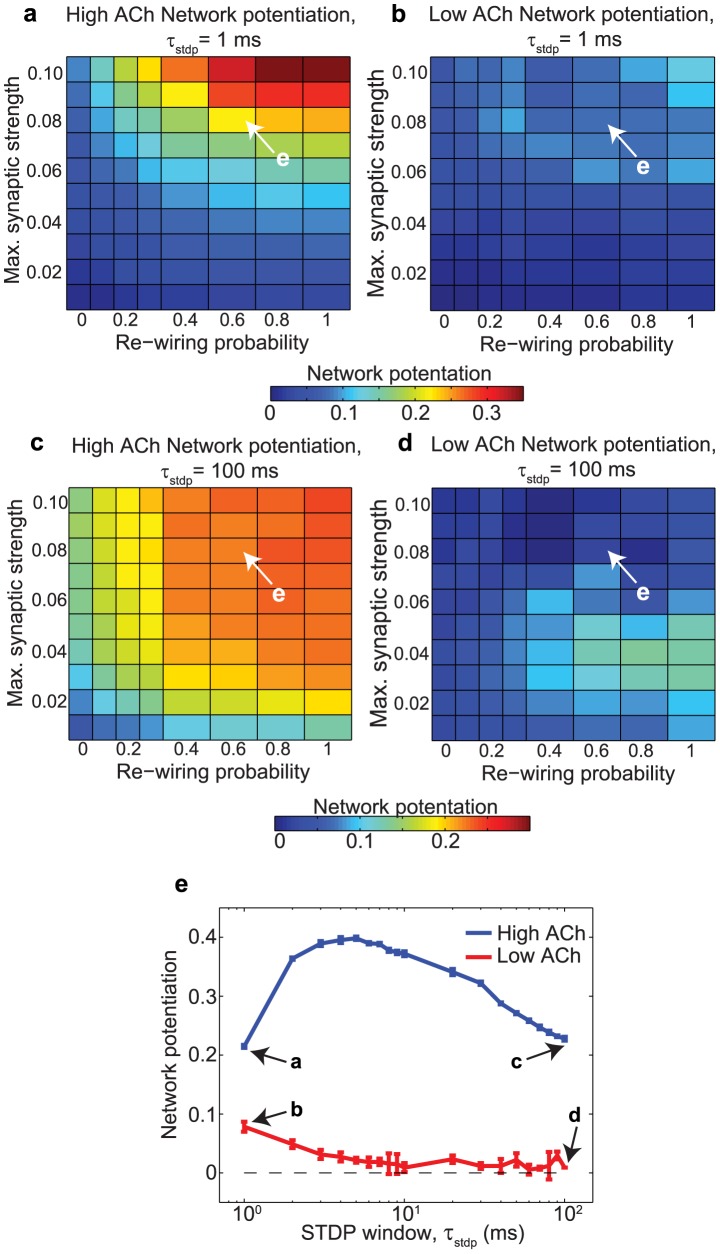
 , upon network potentiation. (a,b) Network potentiation of high-ACh and low-ACh networks as a function of
  and re-wiring probability for
  . (c,d) Network potentiation of high-ACh and low-ACh networks as a function of
  and re-wiring probability for
  . (e) Network potentiation of both high-ACh and low-ACh networks as a function of
  , with
  and a re-wiring probability of 0.60.
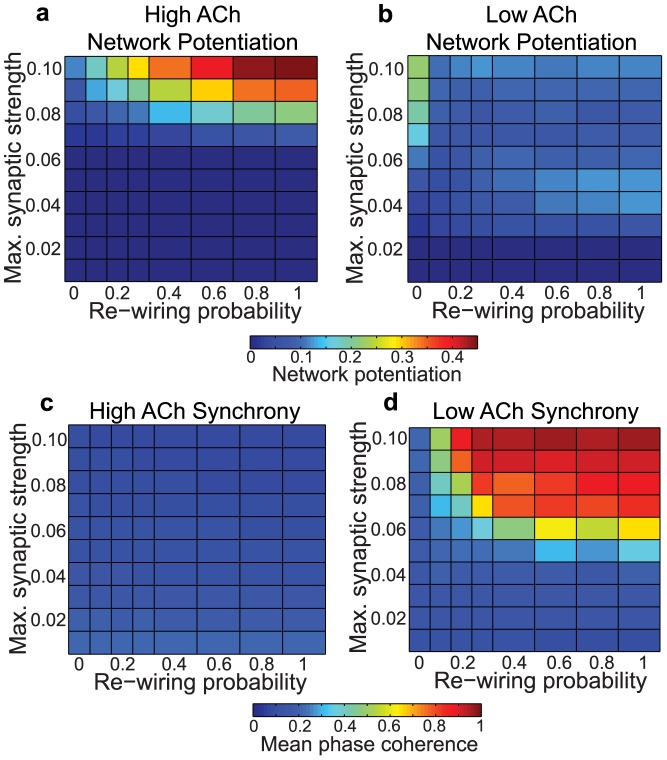
 ,
,  ,
,  , and
, and  .
.
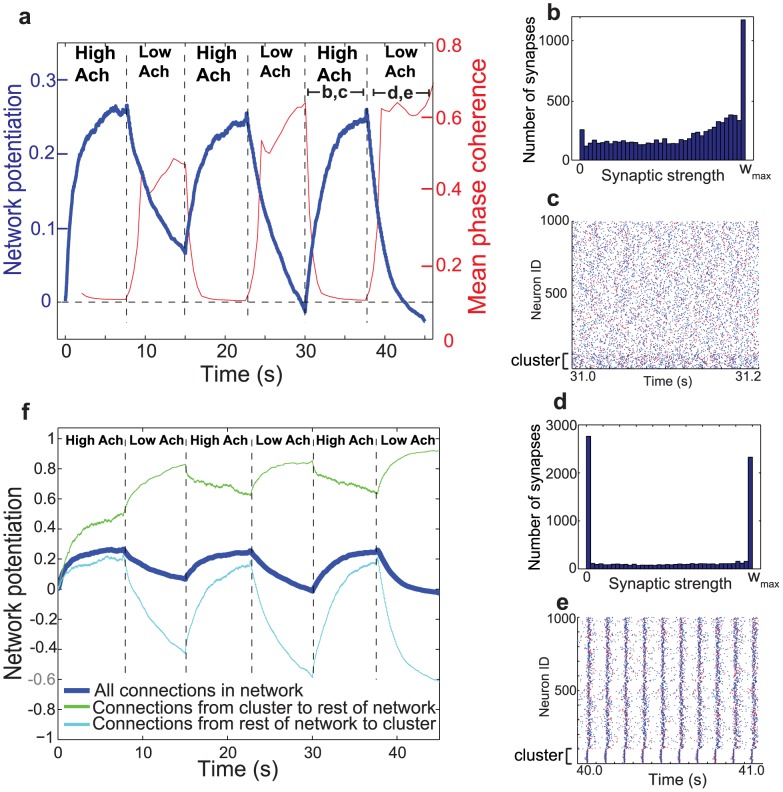
 . (e) Representative raster plot of network activity during the last low-ACh interval. Note how the tight bursting of the cluster drove activity in the rest of the network. (f) Network potentiation computed from distributions of synaptic weights for all synaptic connections (heavy blue curve, as shown in (a)), for synapses originating in the cluster and projecting outside the cluster (green curve), and for synaptic connections originating outside the cluster and projecting to the cluster (light blue curve). During the low-ACh intervals, the connections originating outside the cluster and projecting to the cluster showed extreme relative depotentiation due to the driving of the rest of the network by the cluster.
References
-
- Killgore W (2010) Effects of sleep deprivation on cognition. Prog Brain Res 185: 105–129. - PubMed
-
- Walker M (2008) Cognitive consequences of sleep and sleep loss. Sleep Med 9 Suppl 1: S29–34. - PubMed
-
- Tononi G, Cirelli C (2003) Sleep and synaptic homeostasis: a hypothesis. Brain Research Bulletin 62: 143–150. - PubMed
-
- Tononi G, Cirelli C (2006) Sleep function and synaptic homeostasis. Sleep Medicine Reviews 10: 49–62. - PubMed
-
- Hanlon E, Vyazoyskiy V, Faraguna U, Tononi G, Cirelli C (2011) Synaptic potentiation and sleep need: Clues from molecular and electrophysiological studies. Current Topics in Medicinal Chemistry 11: 2472–2482. - PubMed
Publication types
MeSH terms
Substances
LinkOut - more resources
Full Text Sources
Other Literature Sources
