

Evolution of virulence in emerging epidemics
- PMID: 23516359
- PMCID: PMC3597519
- DOI: 10.1371/journal.ppat.1003209
Evolution of virulence in emerging epidemics
Abstract
Theory predicts that selection for pathogen virulence and horizontal transmission is highest at the onset of an epidemic but decreases thereafter, as the epidemic depletes the pool of susceptible hosts. We tested this prediction by tracking the competition between the latent bacteriophage λ and its virulent mutant λcI857 throughout experimental epidemics taking place in continuous cultures of Escherichia coli. As expected, the virulent λcI857 is strongly favored in the early stage of the epidemic, but loses competition with the latent virus as prevalence increases. We show that the observed transient selection for virulence and horizontal transmission can be fully explained within the framework of evolutionary epidemiology theory. This experimental validation of our predictions is a key step towards a predictive theory for the evolution of virulence in emerging infectious diseases.
Conflict of interest statement
The authors have declared that no competing interests exist.
Figures
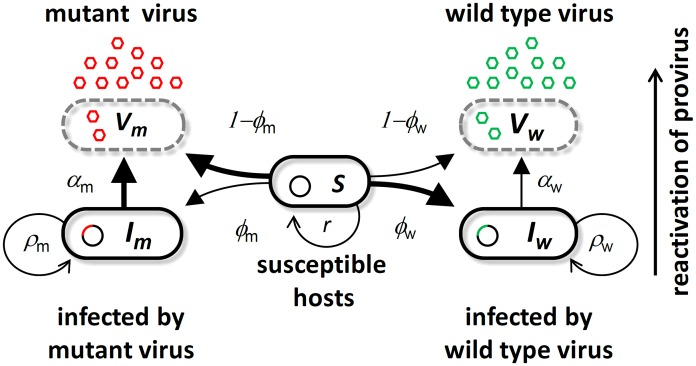
 (green) and the virulent mutant
  (red) infect susceptible cells
  . A proportion of successful infections leads to genome integration at rate
  and
and  to produce infected cells
  and
and  or results in cell lysis at rate
  and
and  . Infected cells lyse through spontaneous reactivation of the provirus at rate
  and
and  for
for  and
and  , respectively. (See Table S1 in Text S1 for the definition and the values of all the parameters of this model).
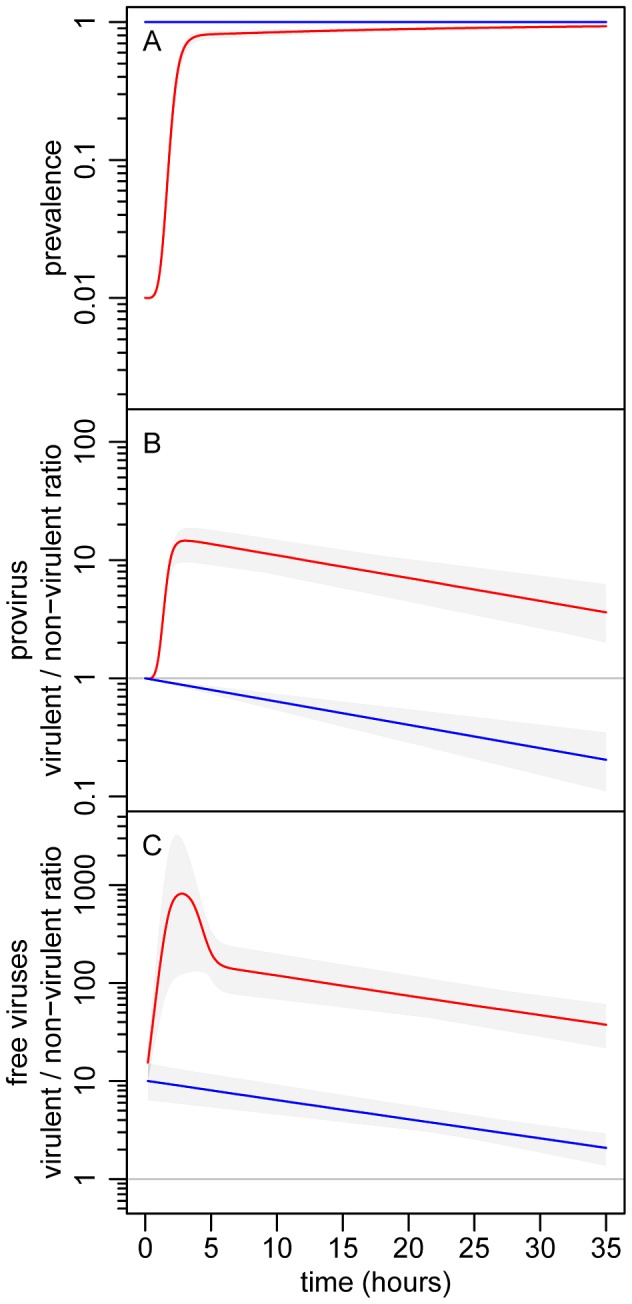
 and
and  ) of the two virus strains. The gray envelopes show the range of variation among all simulation runs and colored lines show the median of these simulations (see section S1.3 in Text S1). See Table S1 in supporting Text S1 for other parameter values.
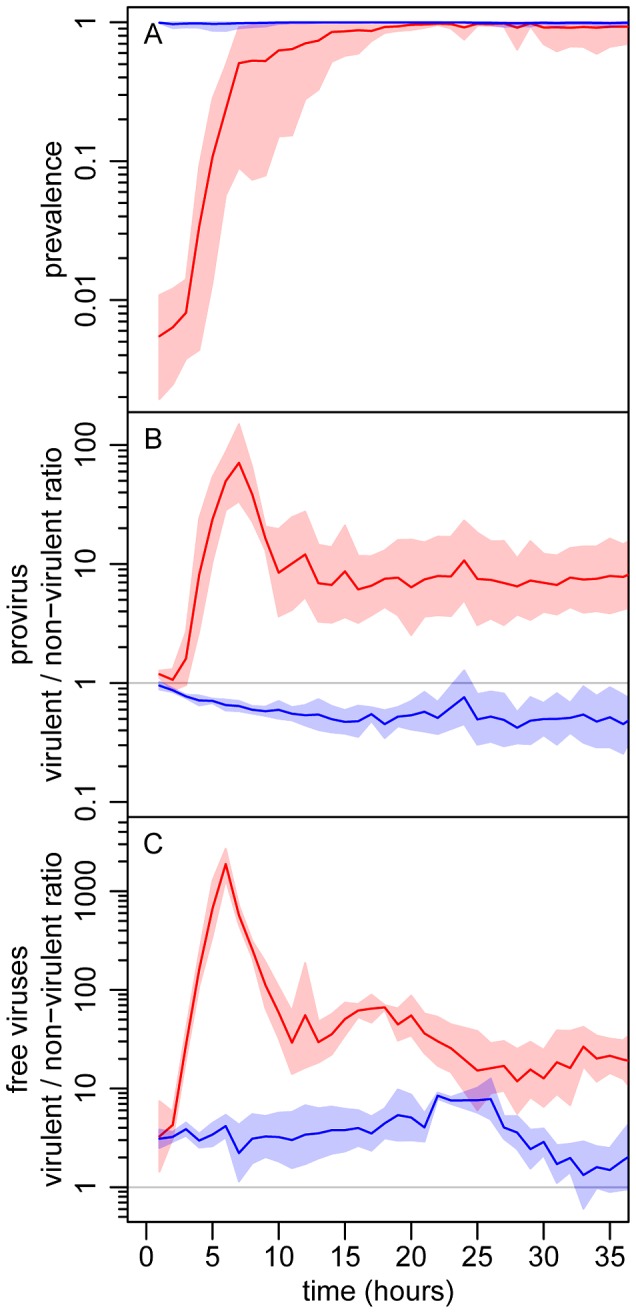
References
-
- Frank SA (1996) Models of parasite virulence. Q Rev Biol 71: 37–78. - PubMed
-
- Dieckmann U, Metz JAJ, Sabelis MW, Sigmund K (2002) Adaptive dynamics of infectious diseases: in pursuit of virulence management. Cambridge: Cambridge University Press. 532 p.
-
- Yoshida T, Jones LE, Ellner SP, Fussmann GF, Hairston Jr NG (2003) Rapid evolution drives ecological dynamics in a predator-prey system. Nature 424: 303–306. - PubMed
-
- Hairston NG, Ellner SP, Geber MA, Yoshida T, Fox JA (2005) Rapid evolution and the convergence of ecological and evolutionary time. Ecology Letters 8: 1114–1127.
-
- Bull JJ, Millstein J, Orcutt J, Wichman HA (2006) Evolutionary feedback mediated through population density, illustrated with viruses in chemostats. Am. Nat 167: E39–E51. - PubMed
Publication types
MeSH terms
Grants and funding
LinkOut - more resources
Full Text Sources
Other Literature Sources
