. 2013 Mar;9(3):e1003211.
doi: 10.1371/journal.ppat.1003211. Epub 2013 Mar 14.

Post-treatment HIV-1 controllers with a long-term virological remission after the interruption of early initiated antiretroviral therapy ANRS VISCONTI Study

Affiliations

Post-treatment HIV-1 controllers with a long-term virological remission after the interruption of early initiated antiretroviral therapy ANRS VISCONTI Study

Asier Sáez-Cirión et al. PLoS Pathog. 2013 Mar.

Abstract

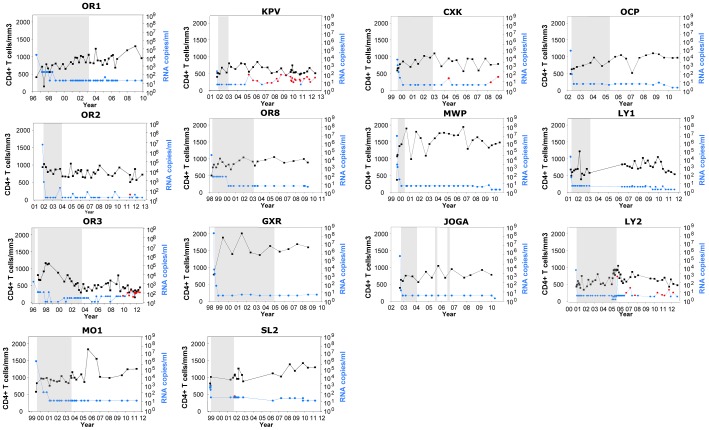
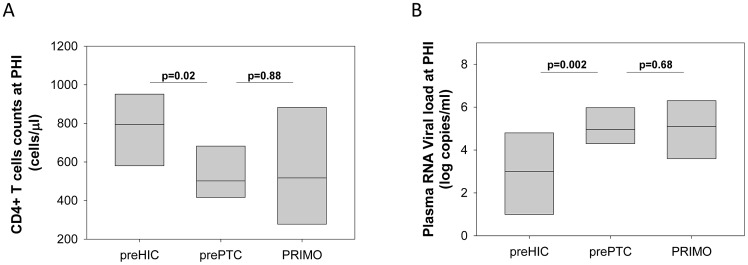
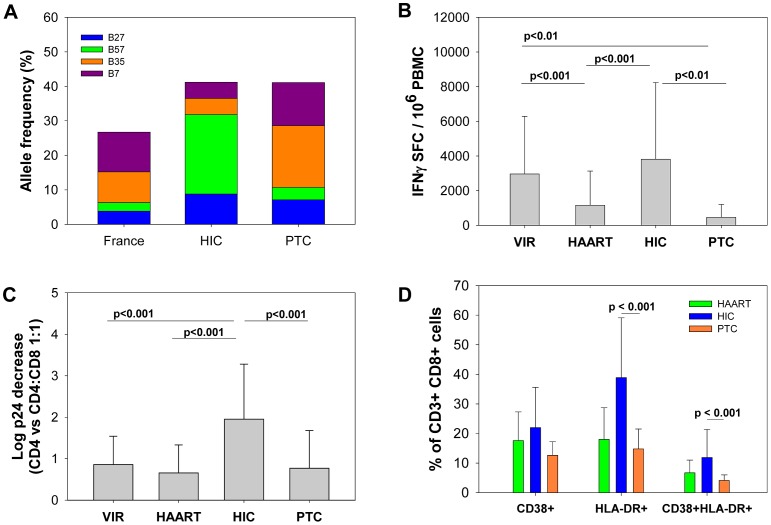
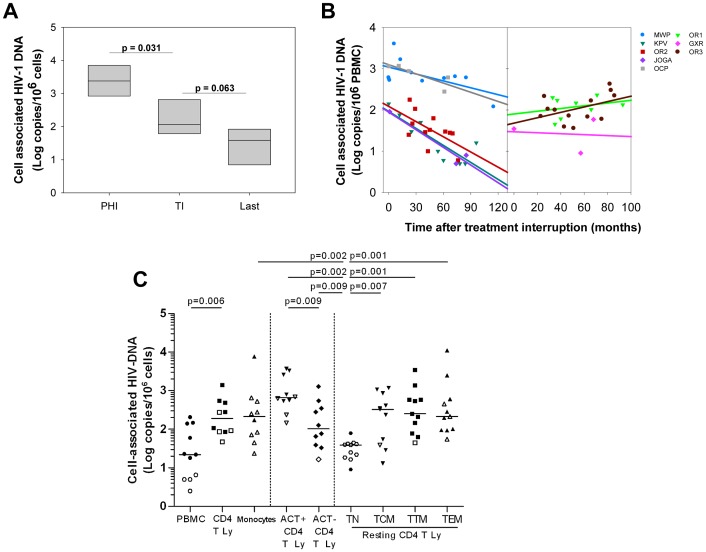
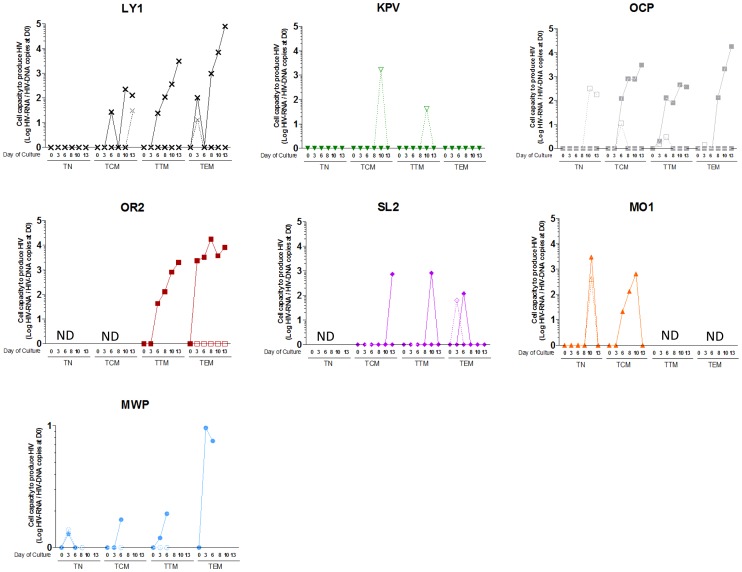
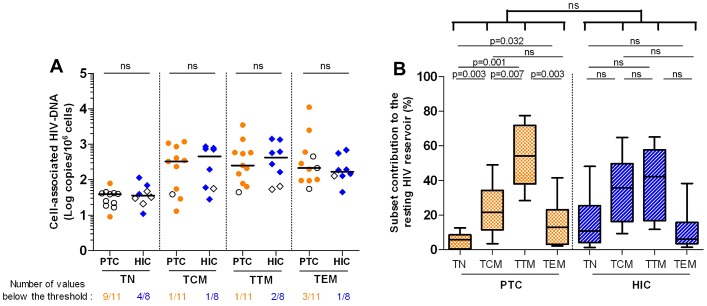
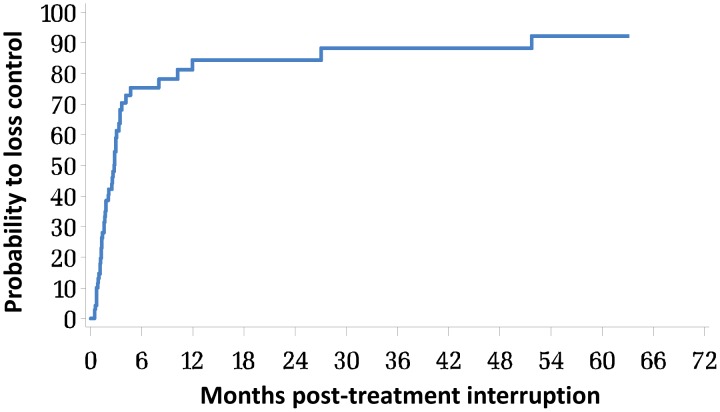
Combination antiretroviral therapy (cART) reduces HIV-associated morbidities and mortalities but cannot cure the infection. Given the difficulty of eradicating HIV-1, a functional cure for HIV-infected patients appears to be a more reachable short-term goal. We identified 14 HIV patients (post-treatment controllers [PTCs]) whose viremia remained controlled for several years after the interruption of prolonged cART initiated during the primary infection. Most PTCs lacked the protective HLA B alleles that are overrepresented in spontaneous HIV controllers (HICs); instead, they carried risk-associated HLA alleles that were largely absent among the HICs. Accordingly, the PTCs had poorer CD8+ T cell responses and more severe primary infections than the HICs did. Moreover, the incidence of viral control after the interruption of early antiretroviral therapy was higher among the PTCs than has been reported for spontaneous control. Off therapy, the PTCs were able to maintain and, in some cases, further reduce an extremely low viral reservoir. We found that long-lived HIV-infected CD4+ T cells contributed poorly to the total resting HIV reservoir in the PTCs because of a low rate of infection of naïve T cells and a skewed distribution of resting memory CD4+ T cell subsets. Our results show that early and prolonged cART may allow some individuals with a rather unfavorable background to achieve long-term infection control and may have important implications in the search for a functional HIV cure.


Conflict of interest statement

The authors have declared that no competing interests exist.

Figures

Figure 1
Figure 1. Long-term control of viremia and stable CD4+ T cell counts in fourteen patients after interruption of antiretroviral treatment initiated in primary HIV-1 infection.
CD4+ T cell counts (in black) and plasma HIV-1 RNA viral loads (in blue) during the follow-up after PHI diagnosis in the 14 PTCs included in the study. The detectable viral loads after treatment interruption are indicated in red. The gray areas represent the periods during which the patients received cART.
Figure 2
Figure 2. Patients to become post-treatment controllers have higher viral loads and lower CD4+ T cell counts than HIV controllers during primary HIV infection.
CD4+ T cell counts (A) and plasma viral load (B) during the primary infection for the patients enrolled in the ANRS PRIMO cohort who later exhibited spontaneous control of infection (preHIC; n = 8) , for the PTCs included in our study (n = 14) and for the patients in the ANRS PRIMO cohort who did not control infection (n = 1,245). The median and the 10th and 90th percentiles are shown for each group.
Figure 3
Figure 3. Post-treatment controllers differ from HIV controllers in terms of HLA class I profile, frequency and quality of the CD8+ T cell response and activation levels of CD8+ T cells.
A. The frequencies of the protective alleles HLA-B*27 and B*57 and the risk alleles HLA-B*07 and B*35 in the general French population (n = 6094 alleles , www.allelefrequencies.net), HICs (n = 148 alleles) and PTCs (n = 28 alleles). The statistical analyses are shown in Table S2. B. The frequency of HIV-specific CD8+ T cells, estimated as the number of CD8+ T cells producing IFN-γ upon stimulation with optimal HIV-1 peptides (spot-forming cells, SFC) in untreated viremic patients (VIRs) (n = 57), treated patients (ARTs) (n = 60), HICs (n = 100) and PTCs (n = 12). C. The capacity of CD8+ T cells from VIRs (n = 22), ARTs (n = 14), HICs (n = 73) and PTCs (n = 14) to suppress the HIV-1 infection of autologous CD4+ T cells, as determined by the log-fold decrease in the level of secreted p24 (CD4 vs. CD4∶CD8 1∶1 cell cultures). D. The percentage of CD8+ T cells from ARTs (n = 5), HICs (n = 58) and PTCs (n = 8) that expressed CD38, HLA-DR or both CD38 and HLA-DR ex vivo. B, C and D. The mean and standard deviation for each group are shown.
Figure 4
Figure 4. Post-treatment controllers have very low levels of cell-associated HIV DNA which keep decreasing after treatment interruption for some patients.
A. Levels of cell-associated HIV-1 DNA (median and IQR) in 6 PTCs at PHI, just before or at treatment interruption (TI), and the last available value obtained at a median of 6 years after cART discontinuation (Last). B. The evolution of cell-associated HIV DNA after treatment interruption in PBMCs from 8 PTCs. The slope of the evolution of HIV-DNA levels after treatment interruption was calculated by linear regression (lines) of the available sequential measures (symbols). Five PTCs experienced a decline of their cell-associated HIV-DNA levels (left); two PTCs maintained stable levels and a positive slope was calculated for OR3 (right). C. Infection levels in various cell populations from 11 PTCs: PBMCs, CD4+ T cells and monocytes; activated and resting CD4+ T cells; resting naïve (TN), central memory (TCM), transitional memory (TTM) and effector memory (TEM) CD4+ T cell subsets (see Figure S2 for the sorting strategy). The open symbols represent values below the threshold of detection. The medians are represented. A, B, C. The results are expressed as the log10 HIV DNA copy numbers per million cells.
Figure 5
Figure 5. HIV replication is inducible from the resting memory CD4 T cell subsets from post-treatment controllers.
The cell capacity to replicate HIV was evaluated in 7 PTCs (each symbol represents one PTC) by stimulating sorted-CD4 T cell subsets with an anti-CD3/anti-CD28 co-stimulation plus IL-2 and IL-7 (filled symbols and continuous lines) or IL-7 alone (empty symbols and dashed lines). HIV RNA was quantified in the supernatants of resting TN, TCM, TTM and TEM cells during a 13-day long culture. Results are expressed as the log10 of the ratio between the HIV RNA copy numbers quantified at a given day of culture and the level of cell-associated HIV DNA in the subset measured at D0 of culture. Kinetics of HIV production in a patient has been represented with connecting lines. HIV RNA values that were under the detection threshold of the technique were arbitrarily placed at 0. ND is not done.
Figure 6
Figure 6. Weak contribution of long-lived resting CD4+ T cells to the HIV reservoir in the post-treatment controllers.
A. HIV infection levels in the resting TN, TCM, TTM and TEM cells of 11 PTCs and 8 HICs. The results are expressed as the log10 HIV DNA copy numbers per million cells, and the medians are represented. The open symbols are values below the threshold of detection. ‘ns’ are non significant p values. B. CD4+ T cell subsets contribution to the resting HIV reservoir, considering both infection levels and frequency. The results are expressed as the median percentage of the resting CD4 HIV reservoir, with interquartile range [25%–75%] and minimum and maximum values. Statistical analyses were applied between all subsets from a single group as well as between each subset from the two groups.
Figure 7
Figure 7. Interruption of long-term treatment initiated at PHI leads to a significant frequency of viremia control.
Kaplan-Meier curve of the probability for patients included in the FHDH between 1997 and 2011 to lose control of viremia after interruption of a, at least, one year-long cART initiated within 6 months of HIV infection, and who had at least one viral load determination 12 months after treatment interruption (n = 74). Loss of control was defined by 2 or more viral loads above 50 RNA copies/mL or one viral load above 50 RNA copies/mL followed by resumption of cART.

References

    1. Antiretroviral-Therapy-Cohort-Collaboration (2008) Life expectancy of individuals on combination antiretroviral therapy in high-income countries: a collaborative analysis of 14 cohort studies. Lancet 372: 293–299. - PMC - PubMed
    1. Wong JK, Hezareh M, Gunthard HF, Havlir DV, Ignacio CC, et al. (1997) Recovery of replication-competent HIV despite prolonged suppression of plasma viremia. Science 278: 1291–1295. - PubMed
    1. Bongiovanni M, Casana M, Tincati C, d'Arminio Monforte A (2006) Treatment interruptions in HIV-infected subjects. J Antimicrob Chemother 58: 502–505. - PubMed
    1. Cain LE, Logan R, Robins JM, Sterne JA, Sabin C, et al. (2011) When to initiate combined antiretroviral therapy to reduce mortality and AIDS-defining illness in HIV-infected persons in developed countries: an observational study. Ann Intern Med 154: 509–515. - PMC - PubMed
    1. Yerly S, Kaiser L, Perneger TV, Cone RW, Opravil M, et al. (2000) Time of initiation of antiretroviral therapy: impact on HIV-1 viraemia. The Swiss HIV Cohort Study. AIDS 14: 243–249. - PubMed

Publication types

MeSH terms