. 2013 Mar;9(3):e1003237.
doi: 10.1371/journal.ppat.1003237. Epub 2013 Mar 14.

The HPV16 E6 oncoprotein causes prolonged receptor protein tyrosine kinase signaling and enhances internalization of phosphorylated receptor species

Affiliations

The HPV16 E6 oncoprotein causes prolonged receptor protein tyrosine kinase signaling and enhances internalization of phosphorylated receptor species

Jennifer M Spangle et al. PLoS Pathog. 2013 Mar.

Abstract

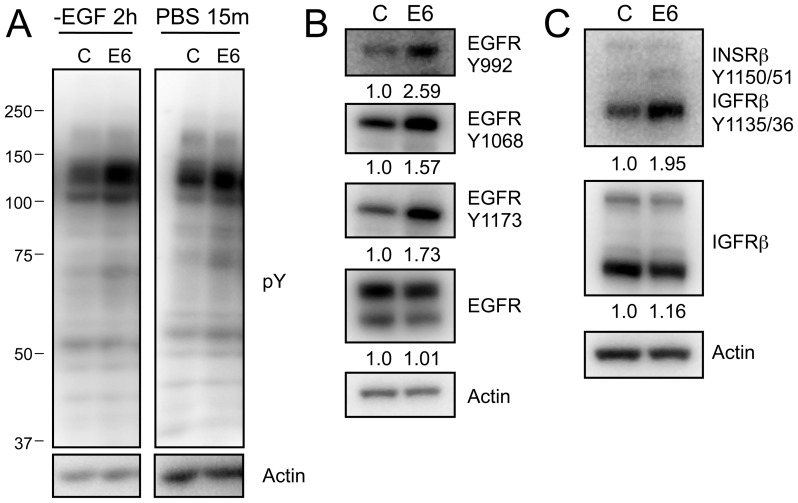
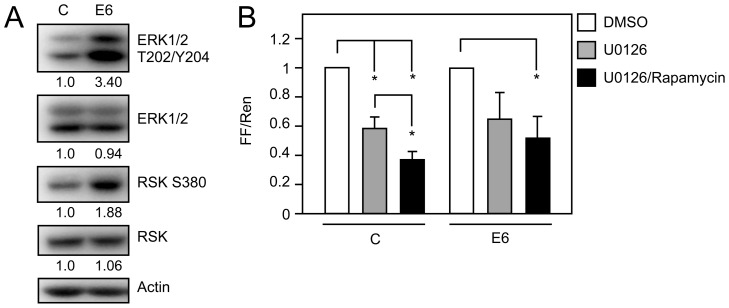
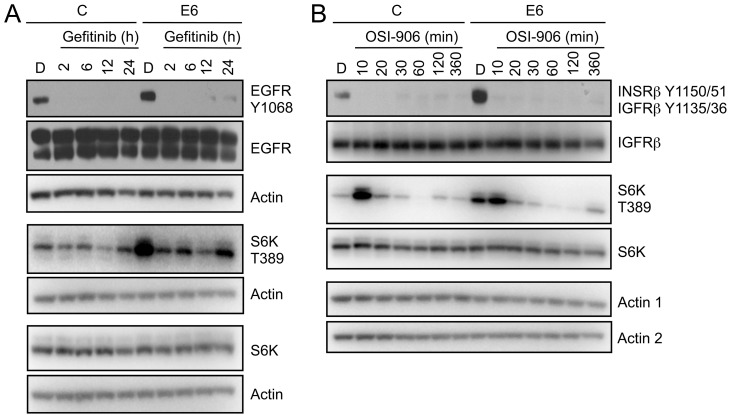
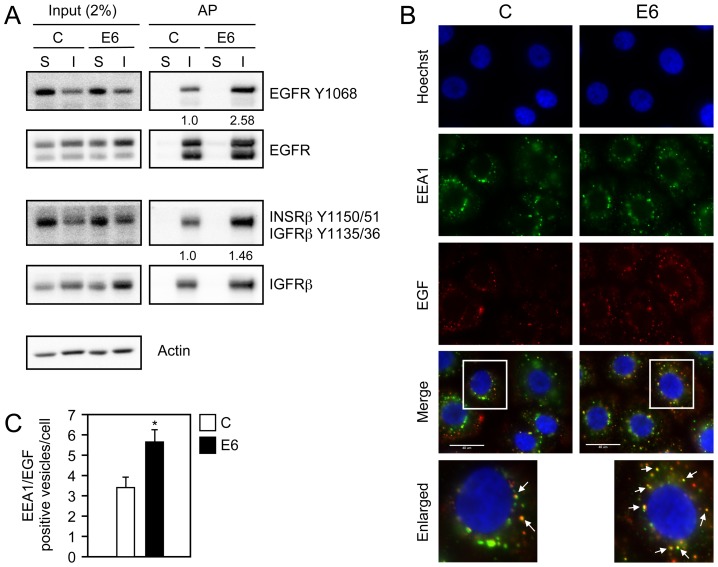
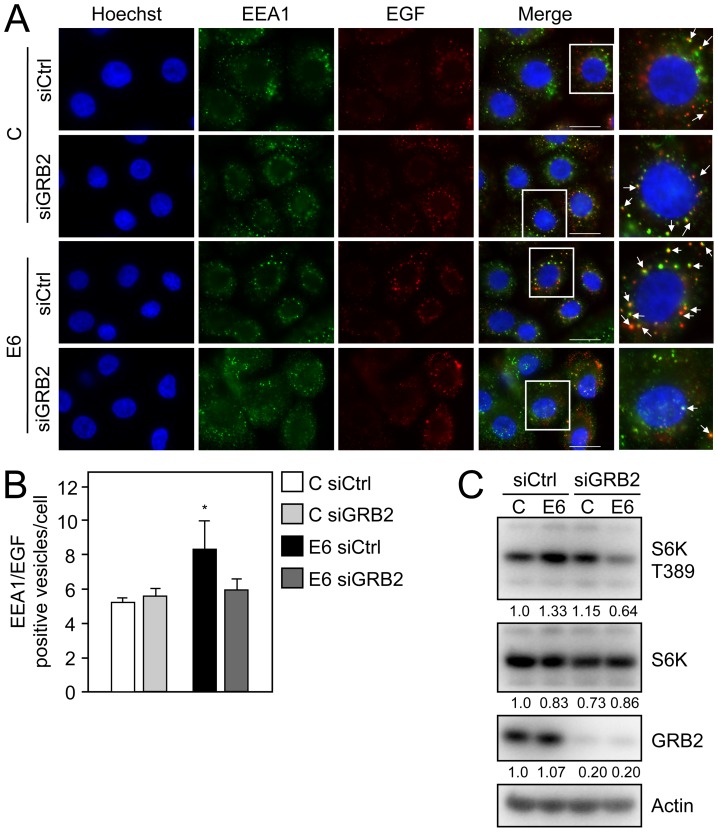
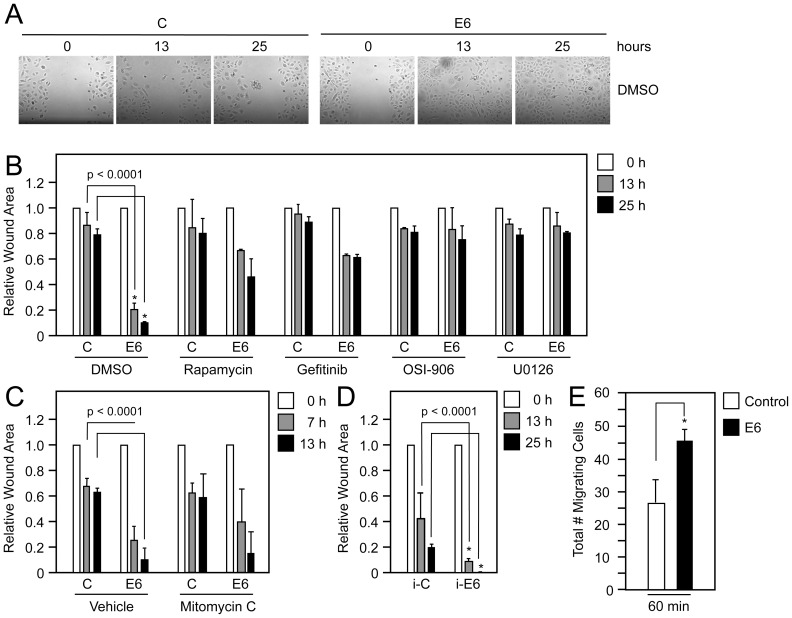
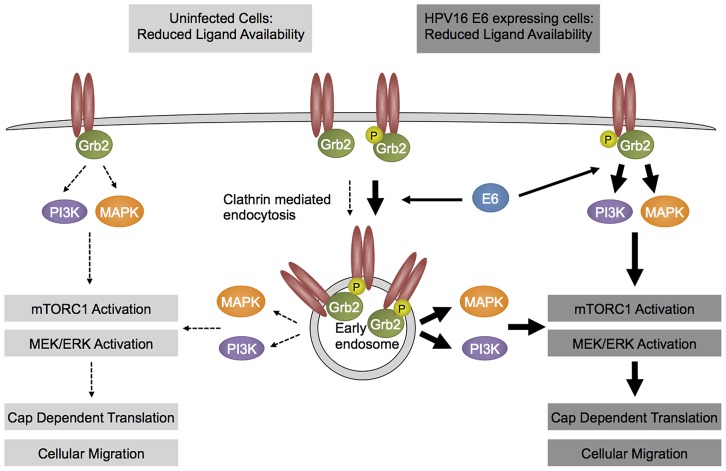
The high-risk human papillomavirus (HPV) E6 proteins are consistently expressed in HPV-associated lesions and cancers. HPV16 E6 sustains the activity of the mTORC1 and mTORC2 signaling cascades under conditions of growth factor deprivation. Here we report that HPV16 E6 activated mTORC1 by enhanced signaling through receptor protein tyrosine kinases, including epidermal growth factor receptor and insulin receptor and insulin-like growth factor receptors. This is evidenced by sustained signaling through these receptors for several hours after growth factor withdrawal. HPV16 E6 increased the internalization of activated receptor species, and the signaling adaptor protein GRB2 was shown to be critical for HPV16 E6 mediated enhanced EGFR internalization and mTORC1 activation. As a consequence of receptor protein kinase mediated mTORC1 activation, HPV16 E6 expression increased cellular migration of primary human epithelial cells. This study identifies a previously unappreciated mechanism by which HPV E6 proteins perturb host-signaling pathways presumably to sustain protein synthesis during the viral life cycle that may also contribute to cellular transforming activities of high-risk HPV E6 proteins.


Conflict of interest statement

The authors have declared that no competing interests exist.

Figures

Figure 1
Figure 1. ERBB2 phosphorylation is increased in HPV16 E6 expressing HFKs.
(A) Western blot analysis of proteins with phosphorylated tyrosine residues following EGF withdrawal (left) or PBS starvation (right) from HFK lysates stably expressing HPV16 E6 (E6) or the pLentiN6.3 control vector (C). (B) and (C) Western blot analyses probing the phosphorylation status of EGFR (B) or INSRβ/IGFRβ (C) using phosphospecific antibodies in HPV16 E6 (E6) or LXSN control vector (C) expressing stable HFKs. Representative experiments from three independent experiments are shown in panels A, B and C. Quantifications relative to actin are shown below each panel.
Figure 2
Figure 2. Signaling pathways downstream of RPTKs are activated in HPV16 E6 expressing HFKs.
(A) Western blot analysis of MAPK signaling by analyzing ERK1/2 and RSK phosphorylation in HFKs with stable expression of HPV16 E6 (E6) or LSXN control vector (C) and experiencing nutrient withdrawal by PBS starvation for 30 minutes. Quantifications relative to actin are shown below each panel. A representative experiment from a total of four independent experiments is shown. (B) HPV16 E6 mediated increase in cap dependent translation is dependent on MEK and mTORC1 signaling. U2OS cells were transfected with pFR_CrPV_xb and the indicated plasmids and processed for firefly and Renilla luciferase activity at 48 hours post transfection. 20 hours prior to lysis, cells were treated with DMSO, 10 µM U0126 (a MEK inhibitor), or a combination of 10 µM U0126 and 100 nM Rapamycin (an mTORC1 inhibitor). Firefly and Renilla luciferase were normalized to levels in DMSO treated cells and are presented as fold changes of normalized firefly relative to normalized Renilla activity. The bar graph represents averages and standard deviations of three independent experiments, each performed in triplicate; the asterisk indicates statistical significance (P<0.05).
Figure 3
Figure 3. RPTK inhibition reduces mTORC1 activation in HPV16 E6 expressing HFKs.
(A) Western blot analysis of EGFR and mTORC1 activation (S6K) in HFKs with stable expression of HPV16 E6 (E6) or pLentiN6.3 control vector (C) following EGFR inhibition with Gefitinib. Cells were treated with DMSO or 1 µM Gefitinib over a 24 hour time course. Actin blots are shown as loading controls. The experiment shown here represents one of three independent experiments. (B) Western blot analysis of INSRβ/IGFRβ and mTORC1 activation (S6K) in HFKs with stable expression of HPV16 E6 (E6) or pLentiN6.3 control vector (C) following INSRβ/IGFRβ chemical inhibition with OSI-906. These data represent one of two independent experiments. Cells were treated with DMSO or 150 nM OSI-906 over a 6 hour time course. Actin blots are shown as a loading control; “actin 1” corresponds to the blots with the phosphospecific antibodies, “actin 2” corresponds the other blots.
Figure 4
Figure 4. Internalization and degradation of activated receptor species are increased in HPV16 E6 expressing HFKs.
(A) Western blot analysis of EGFR and INSRβ/IGFRβ following receptor internalization. After washing the cells with PBS they were incubated with biotin disulfide N-hydroxysulfosuccinimide ester for 40 minutes at 4°C followed by inactivation of the biotin reagent with NH4Cl for 10 min at 4°C. Cells were then stimulated with KSFM lacking growth factors and supplements for 3 hours at 37°C. Following ligand independent stimulation, cells were either lysed without reduction to measure surface bound receptors (S) or reduced and lysed to measure ligand independent internalization (I), Internalization assays were performed as described in the Materials and Methods. Levels of EGFR and INSRβ/IGFRβ in a 5 µg sample, representing 2% of the internalization assay, together with actin, are shown in the left panel (Input), and the resulting streptavidin affinity purification (AP) is shown in the right panel. Quantification representing the ratio of phosphorylated receptors to total receptors normalized to control vector (C) internalized phosphorylated receptors is shown below applicable panels. This experiment represents one of two independent experiments. (B) Immunofluorescence analysis of EGF co-staining with the endosomal marker EEA1 in HFKs with stable expression of HPV16 E6 (E6) or pLentiN6.3 control vector (C) following overnight starvation and stimulation with Alexa 647 labeled EGF (EGF) for 15 minutes. Cells were stained with Hoechst to visualize the nuclei. The scaling bar represents 40 µm. (C) Quantification of the number of EGF positive early endosomes from panel B. Bar graphs represent average numbers of EGF positive early endosomes per cell from four independent experiments. A total of 115 cells were evaluated. Error bars indicate standard deviations; the asterisk indicates statistical significance (P = 0.0017).
Figure 5
Figure 5. The signaling adaptor protein GRB2 is critical for HPV16 E6 mediated EGFR internalization and mTORC1 activation.
(A) Immunofluorescence analysis of EGF co-staining with the endosomal marker EEA1 in GRB2 depleted (siGRB2) or control siRNA transfected (siCtrl) HFKs with stable expression of HPV16 E6 (E6) or pLentiN6.3 control vector (C) following overnight starvation and subsequent stimulation with Alexa 647 labeled EGF (EGF) for 15 minutes. Cells were stained with Hoechst to visualize the nuclei. The scaling bar represents 20 µm. (B) Quantification of the number of EGF positive early endosomes from panel A. Bar graphs represent average numbers of EGF positive early endosomes/cell with counts done in triplicate for a total of at least 95 analyzed cells per condition. Error bars indicate standard deviations; the asterisk indicates statistical significance (P = 0.03). (C) Western blot analysis of S6K T389 in GRB2 depleted (siGRB2) or control siRNA transfected (siCtrl) HFK populations with stable expression of HPV16 E6 (E6) or control vector (C). Cells were transfected with the corresponding siRNAs at 48 hours prior to lysis. An actin blot is shown as a loading control and quantifications relative to actin are shown below each panel. A representative experiment taken from four independent experiments is shown in panel C.
Figure 6
Figure 6. HPV16 E6 increases cellular migration in EGF depleted cells.
(A) Wound healing assays with primary HFKs stably expressing HPV16 E6 (E6) or infected with pLentiN6.3 control vector (C) following wounding of the cellular monolayer in the absence of EGF following RPTK and effector pathway inhibition. Cells were treated with DMSO or 100 nM Rapamycin, 1 µM Gefitinib, 150 nM OSI-906, or 10 µM U0126 and closure of the monolayer was measured over a 25 hour time course. Only images of the DMSO treated samples are shown (B). Quantification of wound closure as shown in (A). Surface areas of wounds were calculated relative to the surface area of the wounds at t = 0 hour. Bar represent averages and standard deviations of three experiments; asterisks indicate statistical significance (P<0.0001). (C) Quantification of wound closure in the presence of 8 µg/ml Mitomycin C to inhibit cellular proliferation. (D) Quantification of wound closure in immortalized HFKs stably expressing HPV16 E6 (E6) or pLentiN6.3 control vector (C) (E). Transwell migration assay with HFKs stably expressing HPV16 E6 (E6) or pLentiN6.3 control vector (C). Cells were seeded in the absence of EGF on the top chamber of a transwell insert and migration to the bottom chamber in the absence of EGF was determined at 30 minutes and 60 minutes after seeding. The bars represent averages and standard deviations of three experiments; the asterisk indicates statistical significance (P<0.05).
Figure 7
Figure 7. Hypothetical model.
HPV16 E6 expressing cells (right) show enhanced activation of RPTKs at least in part by enhancing internalization of activated receptor species as compared to parental cell (left). As a consequence, downstream signaling circuits, including mTORC1 activity remain active even under conditions of limited growth factor availability. See text for details.

References

    1. McLaughlin-Drubin ME, Munger K (2009) Oncogenic activities of human papillomaviruses. Virus Res 143: 195–208. - PMC - PubMed
    1. Scheffner M, Huibregtse JM, Vierstra RD, Howley PM (1993) The HPV-16 E6 and E6-AP complex functions as a ubiquitin-protein ligase in the ubiquitination of p53. Cell 75: 495–505. - PubMed
    1. Gardiol D, Kuhne C, Glaunsinger B, Lee SS, Javier R, et al. (1999) Oncogenic human papillomavirus E6 proteins target the discs large tumour suppressor for proteasome-mediated degradation. Oncogene 18: 5487–5496. - PubMed
    1. Glaunsinger BA, Lee SS, Thomas M, Banks L, Javier R (2000) Interactions of the PDZ-protein MAGI-1 with adenovirus E4-ORF1 and high-risk papillomavirus E6 oncoproteins. Oncogene 19: 5270–5280. - PMC - PubMed
    1. Jing M, Bohl J, Brimer N, Kinter M, Vande Pol SB (2007) Degradation of tyrosine phosphatase PTPN3 (PTPH1) by association with oncogenic human papillomavirus E6 proteins. J Virol 81: 2231–2239. - PMC - PubMed

Publication types

MeSH terms

Substances