. 2013;9(3):e1003362.
doi: 10.1371/journal.pgen.1003362. Epub 2013 Mar 14.

Blood-informative transcripts define nine common axes of peripheral blood gene expression

Affiliations

Blood-informative transcripts define nine common axes of peripheral blood gene expression

Marcela Preininger et al. PLoS Genet. 2013.

Abstract

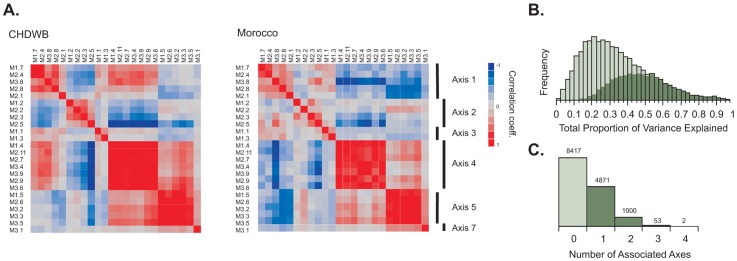
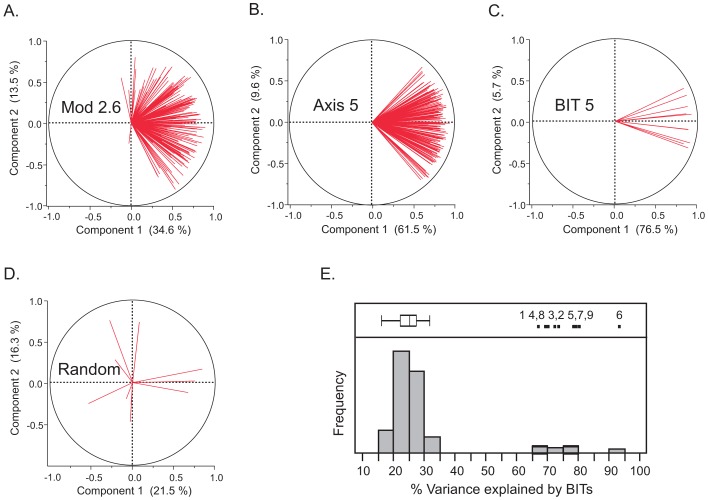
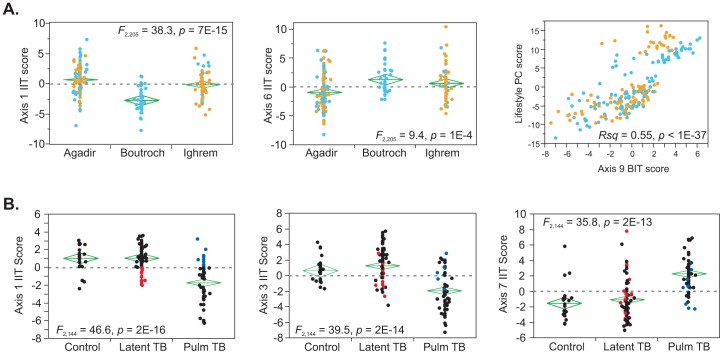
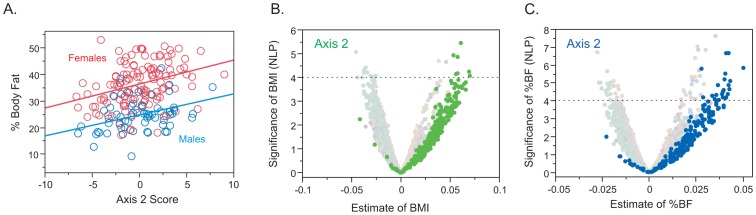
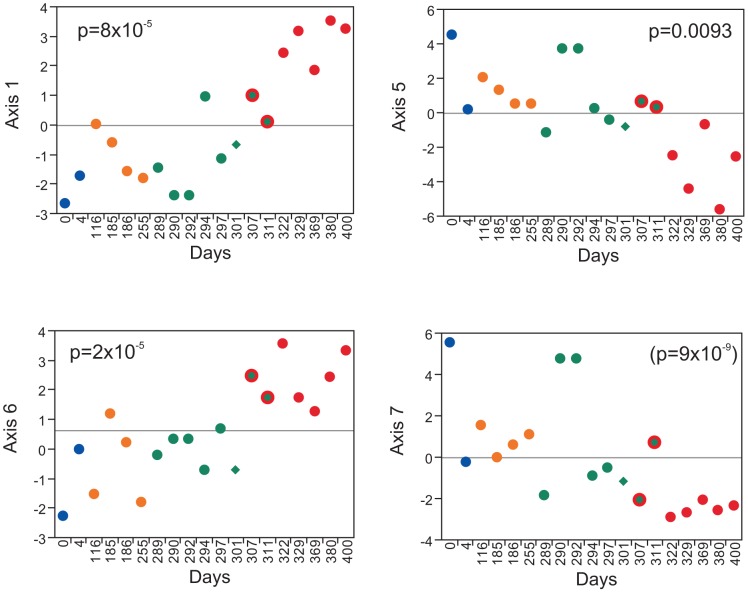
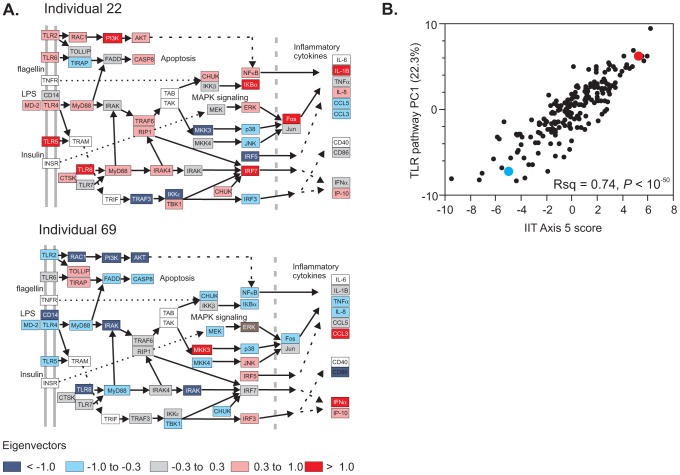
We describe a novel approach to capturing the covariance structure of peripheral blood gene expression that relies on the identification of highly conserved Axes of variation. Starting with a comparison of microarray transcriptome profiles for a new dataset of 189 healthy adult participants in the Emory-Georgia Tech Center for Health Discovery and Well-Being (CHDWB) cohort, with a previously published study of 208 adult Moroccans, we identify nine Axes each with between 99 and 1,028 strongly co-regulated transcripts in common. Each axis is enriched for gene ontology categories related to sub-classes of blood and immune function, including T-cell and B-cell physiology and innate, adaptive, and anti-viral responses. Conservation of the Axes is demonstrated in each of five additional population-based gene expression profiling studies, one of which is robustly associated with Body Mass Index in the CHDWB as well as Finnish and Australian cohorts. Furthermore, ten tightly co-regulated genes can be used to define each Axis as "Blood Informative Transcripts" (BITs), generating scores that define an individual with respect to the represented immune activity and blood physiology. We show that environmental factors, including lifestyle differences in Morocco and infection leading to active or latent tuberculosis, significantly impact specific axes, but that there is also significant heritability for the Axis scores. In the context of personalized medicine, reanalysis of the longitudinal profile of one individual during and after infection with two respiratory viruses demonstrates that specific axes also characterize clinical incidents. This mode of analysis suggests the view that, rather than unique subsets of genes marking each class of disease, differential expression reflects movement along the major normal Axes in response to environmental and genetic stimuli.


Conflict of interest statement

The authors have declared that no competing interests exist.

Figures

Figure 1
Figure 1. Common axes explain a large proportion of expression variation.
(A) Hierarchical clustering of the PC1 scores for 24 Expression Modules in Ref in the Atlanta CHDWB and Morocco datasets shows complete agreement in clustering into 6 meta-modules. These define 6 of the Axes described here, while a 7th Axis emerged on further decomposition of Module 3.1 (B) The frequency distribution of proportion of variance explained by all 9 Axes for each of 14,343 transcript probes (light green) and 7,538 transcript probes (dark green) Bonferroni significant for at least one Axis in a multiple regression. Inclusion of the two additional axes not corresponding to the Chaussabel modules only explains an extra 4% of the variance relative to the first seven. (C) The number of Bonferroni significant axes per transcript in the CHDWB dataset, showing that 39% (5622/14343) of transcript probes associate most strongly with a single axis.
Figure 2
Figure 2. Covariance of gene expression in Modules, Axes, and BIT.
The first four panels illustrate the extent of covariance of gene expression by plotting the loadings for the first two principal component axes for genes related to Axis 5 in the Morocco study in: (A) Module 2.6 identified by Chaussabel et al (ref 12; 167 probes for 105 genes); (B) Axis 5 (which derived partially from Module 2.6; 175 probes for 150 genes); (C) the Blood Informative Transcripts for Axis 5 (10 probes for 10 genes); and (D) a typical random sample of 10 probes. The percent variance explained by the first two components is indicated. Panel (E) shows a histogram of the percent variance explained by component 1 for 100 random sets of 10 probes, relative to the 10 BIT Axes for Morocco to the right (Axis number is in top portion of the panel). Eight of the 9 Axes are plotted for the Atlanta CHDWB dataset in Figure S3A.
Figure 3
Figure 3. Environmental influences on the Axes.
(A) Differences in Axis scores between geographic locations in Morocco (City of Agadir, villages of Boutroch and Ighrem: Berbers, blue; Arabs, yellow) are restricted to Axes 1, 2, 6, and 9, where Axis 6 distinguishes rural from urban, and Axes 1 and 2 distinguish Boutroch only. A grouping of Boutroch residents with Arab women in Ighrem against all others, which represents the major “lifestyle” effect on gene expression generates a PC score that is highly concordant with Axis 9. (B) In the study by Berry et al , pulmonary tuberculosis differs from latent tuberculosis and healthy controls along four Axes (1, 3, 5 and 7), but not along Axes 2 or 5. A small number of individuals shown in red and blue are mis-classified for Axis 1 and 3, and likely have intermediate TB activity status, but this is not apparent for the differentiation of the interferon-response axis 7. None of the axes distinguish latent TB from control. PC1 for the diagnostic transcripts reported in is highly correlated with Axis 1 (London sample R squared = 0.73, p = 10−28, South African sample R squared = 0.81, p = 10−19) and likely reflects divergence along this axis.
Figure 4
Figure 4. Relationship between BMI or Percent Body Fat (%BF) and Gene Expression in the CHDWB study.
(A) Regression of percent body fat (%BF) on Axis 2 score in both sexes. (B) and (C) Volcano plots of significance against effect size for transcripts associated with Axes 2 with BMI (green) and with %BF (blue). The X axis is the estimated correlation between transcript abundance and the trait for each of 3913 unique genes in the 189 individuals in the cohort that are correlated with one or more axes in both Atlanta and Morocco. The dashed horizontal line is at p = 10−4: only 10 points are expected above this line, and these do not yield a clear enrichment for gene ontology classes, but the Axis analysis shows clear up-regulation of the two axes in general.
Figure 5
Figure 5. Axis analysis of the Snyderome.
19 sequential RNA-Seq profiles were mined for BIT Axis scores, which are plotted relative to sampling day for the individual described in . P-values indicate the signifcance associated with t-test comparison of high blood glucose versus normal (Axes 1, 5 and 6) or the comparison of acute phase of viral infection - Days 0, 290 and 292 - versus the remainder. Colors indicate the phases of human rhinovirus infection (HRV; blue), recovery (yellow), respiratory syncitial virus infection (RSV; green), and pre-diabetes/high blood glucose (red). The green triangle corresponds to a spike in cytokine profile at day 301, which does not obviously impact the Axes. The RSV had not yet cleared at days 307 and 311 when the pre-diabetic state first became apparent, so these points are shown in green and red. The other Axes did not show significant changes.
Figure 6
Figure 6. Pathway analysis of transcript abundance.
The relative transcript abundance of 51 transcripts in the KEGG TLR signaling pathway (map04620) is shown for two representative divergent individuals (A). These genes are all co-regulated along Axis 5 (B), resulting in differential activity throughout the pathway. Two representative individuals at either extreme, indicated in red (individual 22) and blue (individual 69) in panel B, clearly differ with respect to which genes have high or low expression relative to regulation of apoptosis, MAPK signaling, and inflammatory cytokine production. This likely has consequences for the sensitivity of neutrophil and other immune cell function. Red, high expression; blue, low expression; gray intermediate, scaled as the eigenvector of PC1.

References

    1. Weedon MN, et al. (2006) Combining information from common type 2 diabetes risk polymorphisms improves disease prediction. PLoS Med 3: e374 doi:10.1371/journal.pmed.0030374 - DOI - PMC - PubMed
    1. Hamburg MA, Collins FS (2010) The path to personalized medicine. N Engl J Med 363: 301–304. - PubMed
    1. Hood L, Heath JR, Phelps ME, Lin B (2004) Systems biology and new technologies enable predictive and preventative medicine. Science 306: 640–643. - PubMed
    1. Pastinen T (2010) Genome-wide allele-specific analysis: insights into regulatory variation. Nat Rev Genet 11: 533–538. - PubMed
    1. Skelly DA, Ronald J, Akey JM (2009) Inherited variation in gene expression. Annu Rev Genomics Hum Genet 10: 313–332. - PubMed

Publication types