

A simulation tool for dynamic contrast enhanced MRI
- PMID: 23516414
- PMCID: PMC3597717
- DOI: 10.1371/journal.pone.0057636
A simulation tool for dynamic contrast enhanced MRI
Erratum in
- PLoS One. 2013;8(9). doi:10.1371/annotation/0263ccf5-239b-48d7-8880-5f4b6b709846
Abstract
The quantification of bolus-tracking MRI techniques remains challenging. The acquisition usually relies on one contrast and the analysis on a simplified model of the various phenomena that arise within a voxel, leading to inaccurate perfusion estimates. To evaluate how simplifications in the interstitial model impact perfusion estimates, we propose a numerical tool to simulate the MR signal provided by a dynamic contrast enhanced (DCE) MRI experiment. Our model encompasses the intrinsic R1 and R2 relaxations, the magnetic field perturbations induced by susceptibility interfaces (vessels and cells), the diffusion of the water protons, the blood flow, the permeability of the vessel wall to the the contrast agent (CA) and the constrained diffusion of the CA within the voxel. The blood compartment is modeled as a uniform compartment. The different blocks of the simulation are validated and compared to classical models. The impact of the CA diffusivity on the permeability and blood volume estimates is evaluated. Simulations demonstrate that the CA diffusivity slightly impacts the permeability estimates (< 5% for classical blood flow and CA diffusion). The effect of long echo times is investigated. Simulations show that DCE-MRI performed with an echo time TE = 5 ms may already lead to significant underestimation of the blood volume (up to 30% lower for brain tumor permeability values). The potential and the versatility of the proposed implementation are evaluated by running the simulation with realistic vascular geometry obtained from two photons microscopy and with impermeable cells in the extravascular environment. In conclusion, the proposed simulation tool describes DCE-MRI experiments and may be used to evaluate and optimize acquisition and processing strategies.
Conflict of interest statement
Figures

 . The diffusion appears restricted near the membranes. (b) Illustration of the geometry lattices. In red, the vessel, in grey the cells. (c) Zoom in the surface weighting lattice
  that computes the number of contact exchange interfaces between a vessel and its periphery.
 (a) and the corresponding MR signal
  (b).
(b).  is simulated for 2 echo times:
  (black) and
  (grey). The change in CA concentration
  , represented by the lattices, and in the magnetic field perturbations
  are presented at five times points labeled (1) to (5). For this longer echo time, one can observe the competition between the susceptibility effect which decreases the signal (point (2)) and the enhancement produced by the
  relaxation effect of the CA which extravasates into the tissue (points (3) to (5)). At the last simulation time point (
 ) (5),
  is lower than
  (not shown) and the concentration in the extravascular space begins to decrease. Note the log scale for
  introduced for sake of clarity.
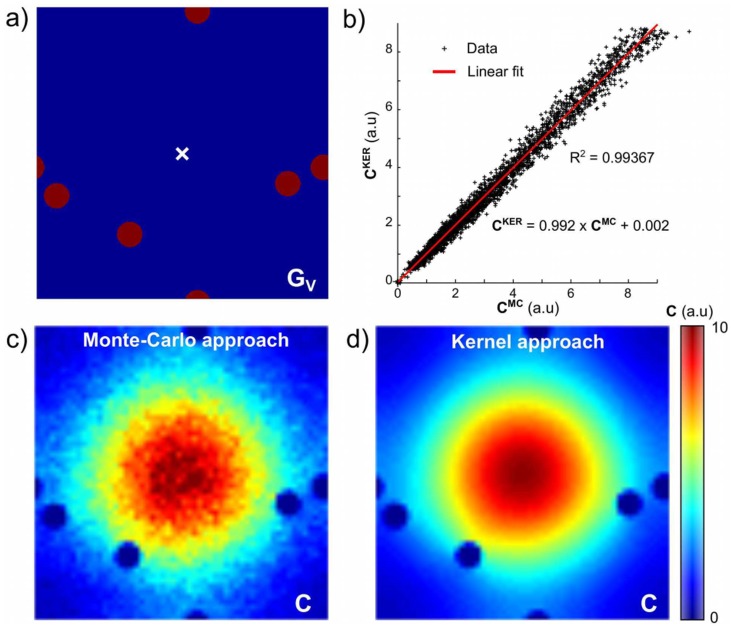
 . The white cross indicates where the CA was initially placed. (b) Spatial correlation plot between
  obtained via the convolution with a diffusion kernel and
  obtained with the MC approach after normalization. (c–d) Final maps of CA concentration,
  , for the MC approach (
 ) and the kernel approach (
 ), respectively (smoothed and undersampled to a
  lattice).
 , as a function of time for impermeable vessel wall (
 ) and different blood flow values. (b) Time course of
  and
and  for
for  and different blood flow values.
  is plotted every 20s to ease readability. The plain black lines represent the fit obtained with the Tofts model (Eq.[14]). Note the difference in scale for the arterial input function,
  . (c) Plots of the estimated permeability coefficient
  and the input value
  for different blood flows and permeabilities to CA. A linear fit is obtained in the case of high flow (
 ). For lower blood flows, the model failed to distinguish the flow from the permeability and
  is underestimated.
 orientation (b) N vessels in 1
  orientation (c) N vessels in 3
  orientations (d) N vessels in 3D. The vessel arrangement is presented in 3D and for display, the magnetic field perturbation is only presented on each face of the cube but is computed in 3D. (e) Normalized FID for approaches (a)–(d) (averaged across the geometries for approaches (b–d)).
 , ADC =
  ,
,  and
and  .
.  across 10 geometries. The data presented here are in excellent agreement with those reported in .
 for 3
for 3  values:
  ,
,  and
and  with
with  . (b) S(t) at
  for 7
for 7  values:
  ,
,  ,
,  ,
,  ,
,  ,
,  and
and  with
with  .
.
 and
and  values: (a) Error on
  when modeling
  . (b) Error on
  when modeling S(t) for
  with Eqs.[16–17].
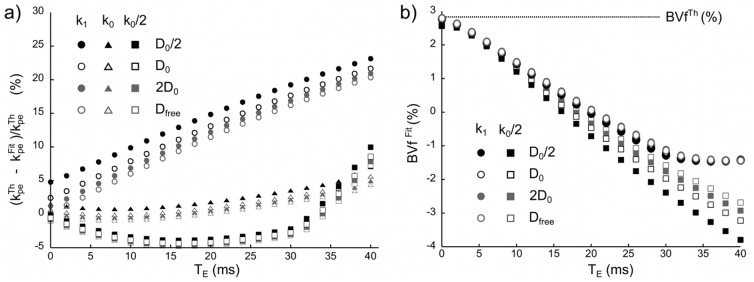
 estimated from
  at different
  for various
  and various
  . (b) Evolution of the parameter
  estimated from
  at different
  , for various
  and for
  or
or  .
.
 and
and  . Concentration map
  (a) and magnetic field perturbation
  (b) are represented at the last simulation time point (
 ). (c) Concentration profiles derived from the simulated MR signal using Eqs.[16–17] at 3 different
  . The black lines correspond to the fit obtained with the Toft model. Plane size
  .
.
 and
and  . At
. At  (a) Concentration map
  with vessels in black and cells in grey. (b) Magnetic field perturbation
  . (c) Concentration profiles derived from the simulated MR signal and using Eqs.[16–17] at 3 different
  . The black lines correspond to the fit obtained with the Toft model. Note the fluctuations in the concentration profiles obtained at long
  . This can be ascribed to the additional magnetic field perturbations induced by the cell interfaces which balance the signal enhancement. Plane size
  .
.References
-
- Sourbron SP, Buckley DL (2012) Tracer kinetic modelling in MRI: estimating perfusion and capillary permeability. Physics in Medicine and Biology 57: R1–R33. - PubMed
-
- Ostergaard L (2005) Principles of cerebral perfusion imaging by bolus tracking. Journal of Magnetic Resonance Imaging 22: 710–717. - PubMed
-
- Franiel T, Hamm B, Hricak H (2011) Dynamic contrast-enhanced magnetic resonance imaging and pharmacokinetic models in prostate cancer. European Radiology 21: 616–626. - PubMed
Publication types
MeSH terms
Substances
LinkOut - more resources
Full Text Sources
Other Literature Sources
Medical
