. 2013;8(3):e57937.
doi: 10.1371/journal.pone.0057937. Epub 2013 Mar 14.

Anti-angiogenic and anti-metastatic activity of synthetic phosphoethanolamine

Affiliations

Anti-angiogenic and anti-metastatic activity of synthetic phosphoethanolamine

Adilson Kleber Ferreira et al. PLoS One. 2013.

Abstract

Background: Renal cell carcinoma (RCC) is the most common type of kidney cancer, and represents the third most common urological malignancy. Despite the advent of targeted therapies for RCC and the improvement of the lifespan of patients, its cost-effectiveness restricted the therapeutic efficacy. In a recent report, we showed that synthetic phosphoethanolamine (Pho-s) has a broad antitumor activity on a variety of tumor cells and showed potent inhibitor effects on tumor progress in vivo.

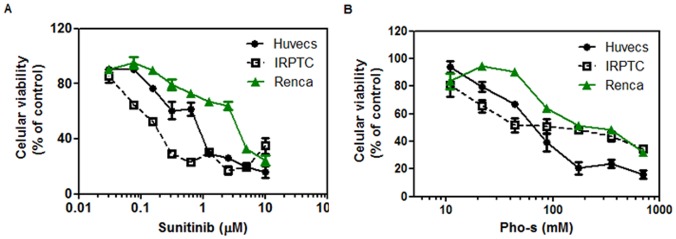
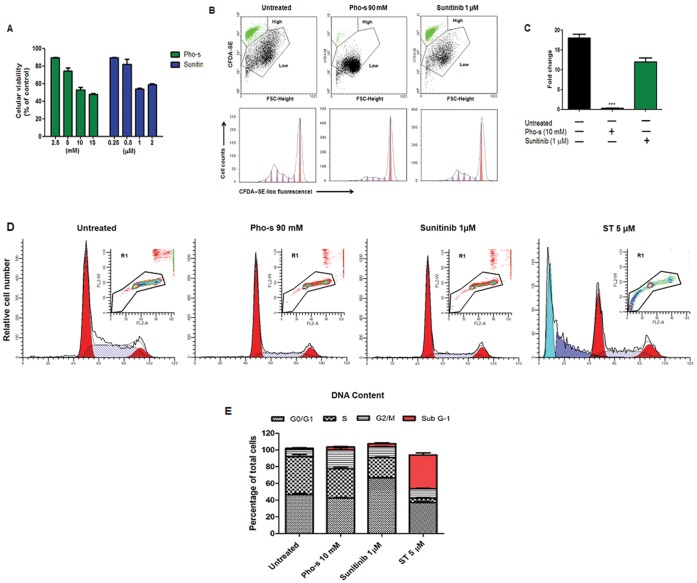
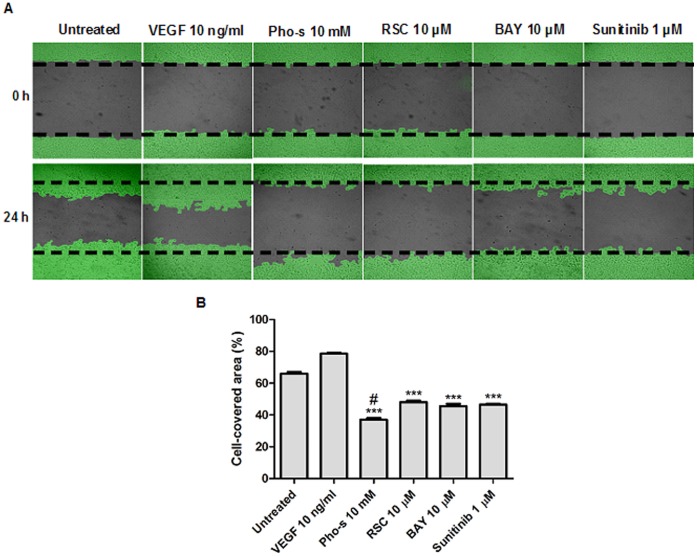
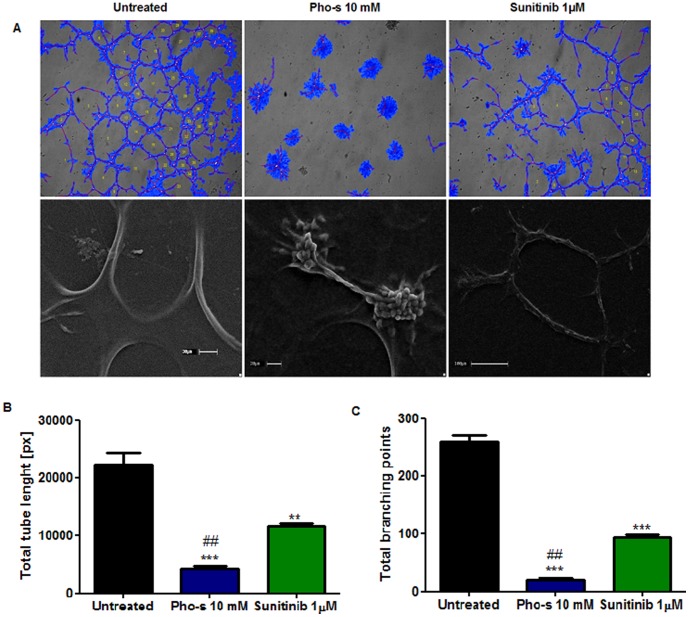
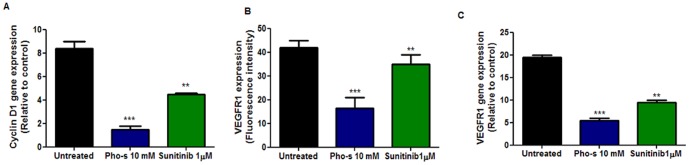
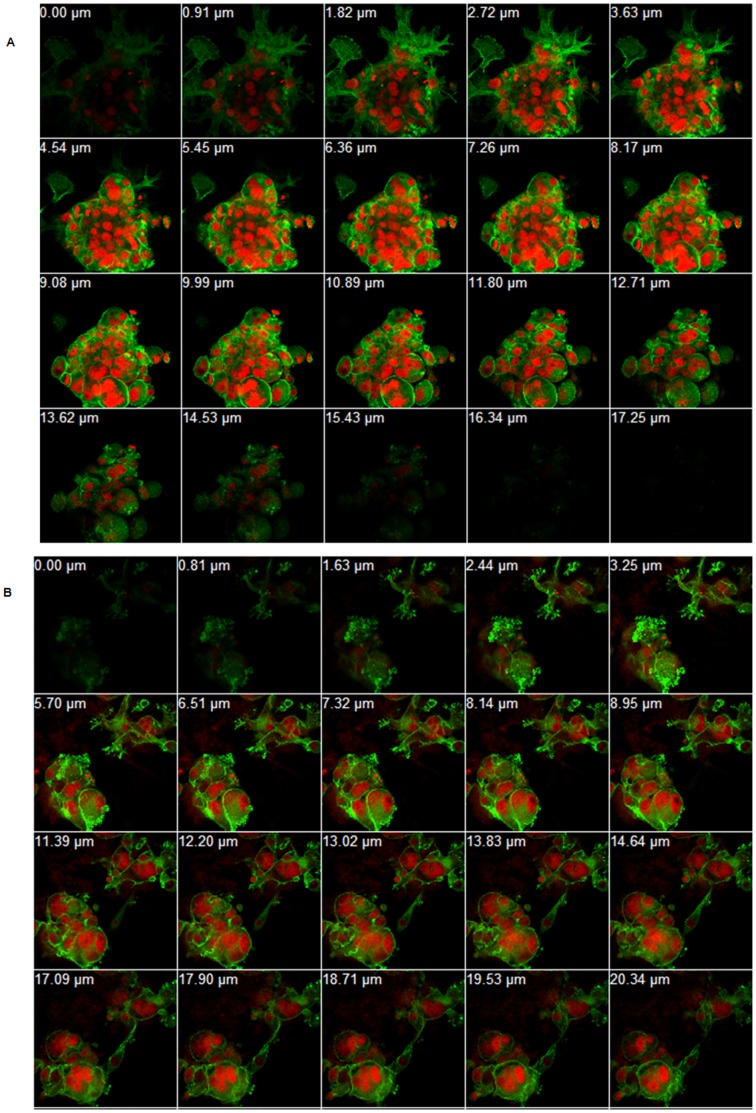
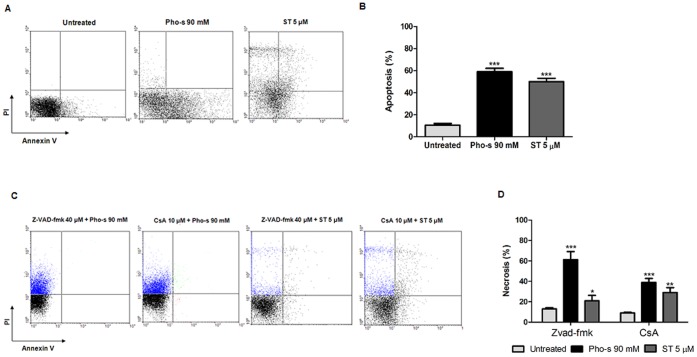
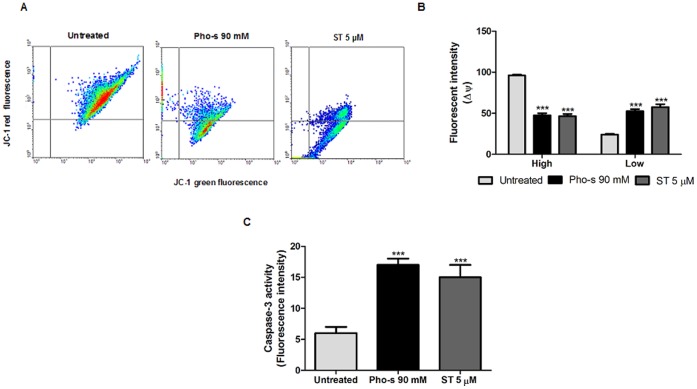
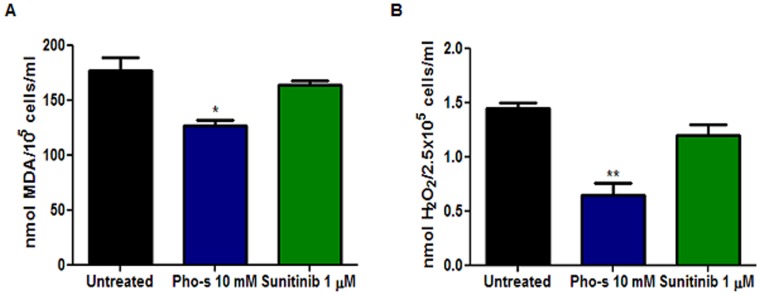
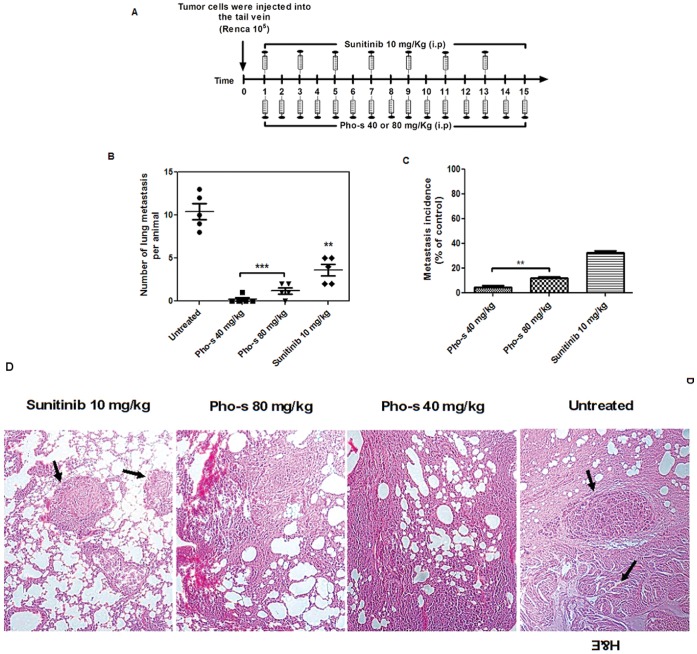
Methodology/principal findings: We show that murine renal carcinoma (Renca) is more sensitive to Pho-s when compared to normal immortalized rat proximal tubule cells (IRPTC) and human umbilical vein endothelial cells (HUVEC). In vitro anti-angiogenic activity assays show that Pho-s inhibits endothelial cell proliferation, migration and tube formation. In addition, Pho-s has anti-proliferative effects on HUVEC by inducing a cell cycle arrest at the G2/M phase. It causes a decrease in cyclin D1 mRNA, VEGFR1 gene transcription and VEGFR1 receptor expression. Pho-s also induces nuclear fragmentation and affects the organization of the cytoskeleton through the disruption of actin filaments. Additionally, Pho-s induces apoptosis through the mitochondrial pathway. The putative therapeutic potential of Pho-s was validated in a renal carcinoma model, on which our remarkable in vivo results show that Pho-s potentially inhibits lung metastasis in nude mice, with a superior efficacy when compared to Sunitinib.

Conclusions/significance: Taken together, our findings provide evidence that Pho-s is a compound that potently inhibits lung metastasis, suggesting that it is a promising novel candidate drug for future developments.


Conflict of interest statement

Competing Interests: The authors have declared that no competing interests exist.

Figures

Figure 1
Figure 1. Effects of Pho-s and Sunitinib on the viability of Renca, IRPTC and HUVEC.
Cells were plated at a density of 104/well and treated with Pho-s (a) and Sunitinib (positive control) (b) for 24 h, and cell viability was assessed by MTT assay. Cell viability is expressed as the percentage of cells comparing the optical density (540 nm) of the treated cells with the optical density of the untreated cells. The data are representative of three independent experiments performed in triplicate.
Figure 2
Figure 2. Inhibition of HUVEC proliferation.
(a) Cell proliferation assessed by MTT assay shows that Pho-s and Sunitinib at subcytotoxic concentrations inhibit cell proliferation of HUVEC in a dose-dependent manner. Cells were labeled with CFDA and analysis was performed by flow cytometry. (b) Dot plot of untreated HUVEC reveals a cell population with a high division index (green). While treatment with 10 mM Pho-s shows a 4.5 fold reduction (*p<0.05) in that high division index of HUVEC, 1 µM Sunitinib did not showed a significant effects, observed after 96 h of treatment. (c) Histogram of treated and untreated HUVEC proliferation. Cell cycle analysis of HUVEC treated with Pho-s, Suninitib and Staurosporine (ST) (positive control of apoptosis) was performed by flow cytometry (d). Pho-s at the concentration of 10 mM arrests the cells at the G2/M phase (e), while Sunitinib at the concentrations of 1 µM inhibits the transition from the G1 to the S-phase and ST induces apoptosis recognized as the sub-G1- peak (e). The % of G2/M and G0/G1 arrests are shown in the bar diagram as mean ±SD from three independent experiments.
Figure 3
Figure 3. Pho-s inhibits cell migration of HUVEC as verified by wound-healing assay.
(a) Representative image of the inhibition of cell migration by Pho-s after 24 h of treatment, compared to Suninitib, Roscovitine (RSC) and BAY 11-7082 (BAY). (b) The % of cell-covered area are shown in the bar diagram as mean ±SD from three independent experiments. Significant differences are indicated as: ***p<0.001 and # p<0.05 statistically different from the Pho-s versus untreated and versus negative controls. Images are taken immediately after scratching the cultures 0 h and 14 h later. (Original magnification, x400).
Figure 4
Figure 4. In vitro endothelial tube formation assay employing Matrigel as a three-dimensional extracellular matrix.
(a) Comparative effect of Pho-s and Sunitinib in HUVEC shows that Pho-s is much potent in mediating anti-angiogenic effects, inhibiting tube formation. Of note, the cells treated with Pho-s remain adherent in spherical clusters, lacking mature tube-like structures as observed by the SEM, while Sunitinib induces morphological changes of cells correlating with inhibition of tube formation. Quantification analysis of tube length (b) and branching points (c) show that Pho-s is effective in inhibiting crucial processes involved in angiogenesis. All conditions were assessed in triplicate, and data are expressed as mean ±SD from three independent experiments.
Figure 5
Figure 5. Pho-s and suninitib decrease cyclin D1 and VEGFR1 gene transcription and VEGFR1 receptor expression.
(a) RT-PCR analysis of cyclin D1 demonstrated that the treatment with 10 mM Pho-s and 1 µM Suninitib reduces cyclin D1 mRNA in HUVEC. Data are expressed as fold increase versus control cells treated with PBS only and are the mean± SD of three experiments. Pho-s and Sunitinib significantly decreased VEGFR1 gene transcription (b) and (c) VEGFR1 receptor expression. The data are representative of three independent experiments performed in triplicate.
Figure 6
Figure 6. Organization of the Renca cells cytoskeleton.
Immunofluorescent staining of Renca cells for the visualization of actin filaments (phalloidin, green) and nucelus (red, PI). Z-series construction of the untreated cell (a), and treated with 10 mM Pho-s for 12 h (b). Pho-s induces morphological changes in the actin cytoskeleton and induces nuclear fragmentation in Renca cells. (Original magnification x60).
Figure 7
Figure 7. Mitochondrial membrane depolarization and caspase-3 activity induced by Pho-s in Renca cells.
(a) Representative dot plots of cells stained with JC-1 dye are shown. The decrease of green fluorescence monomers correlates with the mitochondrial depolarization (Low), and cells exhibiting red fluorescence, which are viable cells (High). (b) The fluorescence intensities of JC-1 were determined by flow cytometry based on the dot plots analysis. (c) Caspase-3 activity increases were accompanied with a reduction of ΔΨ in Renca cells, induced by Pho-s and ST. The data are representative of three independent experiments performed in triplicate. Significant differences are indicated as: ***p<0.001 statistically different from the Pho-s versus untreated.
Figure 8
Figure 8. Pho-s induces apoptosis though the mitochondrial-dependent pathway in Renca cells.
(a) Dot plot profile represents V-FITC/PI staining showing the percentage of apoptotic cells. (b) An increase of apoptotic cells was observed after 12 h of treatment with 90 mM Pho-s. (c) The mitochondrial dependent mechanism was evaluated following pretreatment with 40 µM Z-VAD-fmk or 2.5 mM cyclosporin A (CsA), and evaluated by V-FITC/PI staining using flow cytometry. (d) The increase of necrosis induced by Pho-s and ST indicated that Pho-s induces its apoptotic effects through the mitochondrial-dependent pathway. The data are representative of three independent experiments performed in triplicate.
Figure 9
Figure 9. Lipid peroxidation and hydrogen peroxide formation.
Renca cells were treated with 90 mM of Pho-s or 5 µM Sunitinib for 12 h, and then were analyzed as described in Materials and Methods. The detection of MDA and H2O2 was evaluated through the thiobarbituric acid and horseradish peroxidase assay, respectively. The data are representative of three independent experiments performed in triplicate.
Figure 10
Figure 10. Pho-s inhibits lung metastasis of Renca cells in BALB/c mice.
(a) Schedule of treatment of Pho-s and Sunitinib. 1×10⁶ Renca cells were injected via the tail vein, and on the fourth day after the tumor implant, the treatment (i.p.) was started with Pho-s at the concentrations of 50 and 100 mg/kg/day and 10 mg/kg/day of Sunitinib and continued for 15 days. Both concentrations of Pho-s, significantly (***p<0.001) reduced both the number of lung metastasis per animal (b) and the incidence of metastasis (c), when compared to untreated mice and to treatment with Sunitinib. (d) H&E sections of lung metastasis 15 days after tumor inoculation from untreated mice and mice treated with 10 mg/kg Suntinib show the multiple metastatic foci (arrows), while in mice treated with Pho-s at both doses almost no metastatic foci can be seen. (Original magnification x20).

References

    1. SEER Star Database: Incidence SEER 9 Regs Public-Use, November 2002 Sub (1973–2000). (2003) Surveillance, Epidemiology, and End Results (SEER) Program. Bethesda: National Cancer Institute, Division of Cancer Control and Population Sciences, Surveillance Research Program, Cancer Statistics Branch.
    1. Garcia-Donas J, Esteban E, Leandro-García LJ, Castellano DE, del Alba AG, et al. (2011) Single nucleotide polymorphism associations with response and toxic effects in patients with advanced renal-cell carcinoma treated with first-line Sunitinib: a multicentre, observational, prospective study. Lancet Oncol 12: 1143–1150. - PubMed
    1. Sotgia F, Martinez-Outschoorn UE, Lisanti MP (2011) Mitochondrial oxidative stress drives tumor progression and metastasis: should we use antioxidants as a key component of cancer treatment and prevention? BMC Med 23: 9–62. - PMC - PubMed
    1. Ralph SJ, Rodríguez-Enríquez S, Neuzil J, Saavedra E, Moreno-Sánchez R (2010) The causes of cancer revisited: “mitochondrial malignancy” and ROS-induced oncogenic transformation-why mitochondria are targets for cancer therapy. Mol Aspects Med 31: 145–170. - PubMed
    1. Fiaschi T, Chiarugi P (2012) Oxidative stress, tumor microenvironment, and metabolic reprogramming: a diabolic liaison. Int J Cell Biol 2012: 762825. - PMC - PubMed

Publication types

MeSH terms