. 2013;8(3):e58532.
doi: 10.1371/journal.pone.0058532. Epub 2013 Mar 14.

Elevated rate of fixation of endogenous retroviral elements in Haplorhini TRIM5 and TRIM22 genomic sequences: impact on transcriptional regulation

Affiliations

Elevated rate of fixation of endogenous retroviral elements in Haplorhini TRIM5 and TRIM22 genomic sequences: impact on transcriptional regulation

William E Diehl et al. PLoS One. 2013.

Abstract

All genes in the TRIM6/TRIM34/TRIM5/TRIM22 locus are type I interferon inducible, with TRIM5 and TRIM22 possessing antiviral properties. Evolutionary studies involving the TRIM6/34/5/22 locus have predominantly focused on the coding sequence of the genes, finding that TRIM5 and TRIM22 have undergone high rates of both non-synonymous nucleotide replacements and in-frame insertions and deletions. We sought to understand if divergent evolutionary pressures on TRIM6/34/5/22 coding regions have selected for modifications in the non-coding regions of these genes and explore whether such non-coding changes may influence the biological function of these genes. The transcribed genomic regions, including the introns, of TRIM6, TRIM34, TRIM5, and TRIM22 from ten Haplorhini primates and one prosimian species were analyzed for transposable element content. In Haplorhini species, TRIM5 displayed an exaggerated interspecies variability, predominantly resulting from changes in the composition of transposable elements in the large first and fourth introns. Multiple lineage-specific endogenous retroviral long terminal repeats (LTRs) were identified in the first intron of TRIM5 and TRIM22. In the prosimian genome, we identified a duplication of TRIM5 with a concomitant loss of TRIM22. The transposable element content of the prosimian TRIM5 genes appears to largely represent the shared Haplorhini/prosimian ancestral state for this gene. Furthermore, we demonstrated that one such differentially fixed LTR provides for species-specific transcriptional regulation of TRIM22 in response to p53 activation. Our results identify a previously unrecognized source of species-specific variation in the antiviral TRIM genes, which can lead to alterations in their transcriptional regulation. These observations suggest that there has existed long-term pressure for exaptation of retroviral LTRs in the non-coding regions of these genes. This likely resulted from serial viral challenges and provided a mechanism for rapid alteration of transcriptional regulation. To our knowledge, this represents the first report of persistent evolutionary pressure for the capture of retroviral LTR insertions.


Conflict of interest statement

Competing Interests: The authors have declared that no competing interests exist.

Figures

Figure 1
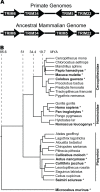
Figure 1. Evolutionary history of TRIM5 and the primate species involved in this study.
(A) Graphical depiction of the TRIM6/34/5/22 genomic locus of primates as well as a depiction of the hypothetical ancestral mammalian genomic locus. (B) Phylogenetic tree showing the evolutionary relationship of primate species representative of the most prominent genera of primate evolution. The following species were examined in this study: human (Homo sapiens), chimpanzee (Pan troglodytes), white-cheeked gibbon (Nomascus leucogenys), olive baboon (Papio anubis), rhesus macaque (Macaca mulatta), guereza colobus (Colobus guereza), Peruvian red-necked owl monkey (Aotus nancymaae), common marmoset (Callithrix jacchus), Bolivian squirrel monkey (Saimiri boliviensis boliviensis), dusky titi (Callicebus moloch), and grey mouse lemur (Microcebus murinus). These species are highlighted using ‘*’ as well as bold lettering. This phylogenetic tree was adapted from Bininda-Emonds et al. 2007, and uses the revised dates published with the corrigendum on the original article.
Figure 2
Figure 2. TRIM genes are variably conserved as a result of differential rates of indel turnover.
Transcribed genomic sequences of the TRIM5, TRIM6, TRIM22, and TRIM34 genes were hand aligned. Using the formulas presented in the Materials and Methods, the nucleotide alignments were used to calculate the following statistics for all pairs of nucleotide sequences: the percent nucleotide identity (A), the nucleotide substitution rate (B), and the rate of indel change (C). The rate of change depicted in these figures is calculated as percent per million years, the black circles indicate separate pairwise sequence comparisons and the bars represent mean values. In panels A-C, statistical significance was calculated using the Friedman test, a one-way repeated measures ANOVA without assuming Gaussian distributions and using the Dunn’s post-test to compare all genes against one another. A p-value of less than 0.05 is denoted by *, a p-value less than 0.01 is denoted by **, a p-value less than 0.001 is denoted by ***. For each gene, the correlation between nucleotide identity and the rate of indel change was examined using Spearman’s rank correlation (D-G). The Spearman r and p-values resulting from this analysis are indicated in each panel.
Figure 3
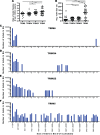
Figure 3. TRIM5 and TRIM22 display elevated rates of indel fixation as well as fixation of larger indels.
Using the formulas presented in the Materials and Methods, the nucleotide alignments were used to calculate the following statistics for all pairs of nucleotide sequences: the rate of indel creation (A) and the average indel size (B). Dots indicate separate pairwise sequence comparisons and the black bars represent mean values. Statistical significance was calculated using the Friedman test, a one-way repeated measures ANOVA without assuming Gaussian distributions and using the Dunn’s post-test to compare all genes against one another. A p-value of less than 0.05 is denoted by *, a p-value less than 0.01 is denoted by **, a p-value less than 0.001 is denoted by ***. Indels present in pairwise comparisons of each gene were separated by size and placed into a corresponding 100 nucleotide ‘bin’. The number of indels present in each bin is depicted for TRIM6 (C), TRIM34 (D), TRIM22 (E), and TRIM5 (F).
Figure 4
Figure 4. TRIM5 and TRIM22 contain more transposable elements than TRIM6 or TRIM34.
The absolute number of transposable elements present in each TRIM gene was tallied for each species and the results are depicted in panel (A). Black dots represent the number of transposable elements found in a given primate species and the black bar represents the mean value. The quantitation shown in (A) was performed without regard for identity or conservation of the elements present, therefore the number of novel transposable elements was considered. In panel (B), the number of unique transposable elements present in pairwise comparisons of each TRIM gene is shown. The black dots indicate number of elements in an individual pairwise sequence comparison and the black bar represents the mean value. In panels (A) and (B), statistical significance was calculated using the Friedman test, a one-way repeated measures ANOVA without assuming Gaussian distributions and using the Dunn’s post-test to compare all genes against one another. A p-value of less than 0.05 is denoted by *, a p-value less than 0.01 is denoted by **, a p-value less than 0.001 is denoted by ***. Correlations between average indel size and the number of unique transposable elements were examined TRIM6 (C), TRIM34 (D), TRIM22 (E), and TRIM5 (F). Statistical significance was assessed using Spearman’s rank correlation the r and p-values resulting from this analysis are indicated in each panel. Comparisons involving colobus TRIM6, which contains a 6-kb LINE L1 element insertion, are indicated with red dots.
Figure 5
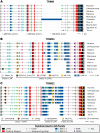
Figure 5. Graphical depiction of the genomic structure and location of transposable elements in the TRIM6, TRIM34, and TRIM22 genes.
RepeatMasker was used to identify repetitive elements present in the genomic TRIM gene sequences and these elements were mapped onto the multiple sequence alignments. Graphical representations of the exon/intron structure as well as the various transposable elements found in TRIM6 (A), TRIM34 (B), or TRIM22 (C) are shown. Figures are drawn to approximate scale, with a 1 kb scale bar shown in the legend of each panel. Symbols common to all genes analyzed are shown at the bottom of the figure, while symbols representing non-conserved transposable elements are shown in the panel in which they are present.
Figure 6
Figure 6. Graphical depiction of the genomic structure and location of transposable elements in the TRIM5.
In the same fashion as Figure 5, repetitive elements were identified in TRIM5 genes using RepeatMasker and were mapped onto the exon/intron structure of TRIM5. The figure is drawn to approximate scale, with a 1 kb scale bar in the legend. The top most structure represents the exon/intron structure of the gene and all subsequent structures superimpose the unique transposable elements and/or deletions specific to the indicated primate species. Symbols representing all transposable elements are at the bottom of the figure.
Figure 7
Figure 7. The grey mouse lemur TRIM6/34/5 genomic locus exhibits a novel architecture, while the genes largely maintain ancestral transposable element content.
Panel (A) depicts the relative location and orientation of genes and pseudogenes present in the TRIM5 genomic locus of the grey mouse lemur. Similar to Figures 5 and 6, RepeatMasker was used to identify repetitive elements present in genes of this locus and graphical representations overlaying the identified transposable elements on the exon/intron structure of TRIM6 (B), TRIM34-2 (C), and TRIM5-1 and TRIM5-2 (D). Symbols representing non-conserved transposable elements as well as 1 kb scale bars are presented in the panel with which they are associated, while symbols common to all genes are shown at the bottom of the figure.
Figure 8
Figure 8. LINE L1 associated evolution in the fourth intron.
The number of nucleotides of LINE L1 origin (A), and the size of the fourth intron (B) were calculated for each of the TRIM genes examined. In both panels, the red dots represent the fourth intron of New World primates, while the blue dots represent the fourth intron of Old World primates. The black bars represent average values. Statistical significance was calculated using the Friedman test, a one-way repeated measures ANOVA without assuming Gaussian distributions and using the Dunn’s post-test to compare all genes against one another. A p-value of less than 0.05 is denoted by *, a p-value less than 0.01 is denoted by **, a p-value less than 0.001 is denoted by ***.
Figure 9
Figure 9. Transcription of TRIM22 from different primate species is differentially regulated following p53 induction.
Following a 3-day stimulation with PHA, PBMCs from humans, rhesus macaques, or squirrel monkeys were treated with doxorubicin or DMSO control for 24 hours. Total RNA was harvested and levels of (A) TRIM22, (B) MDM2, (C) TRIM5, and (D) β-actin mRNA were assessed using SYBR green-based qPCR with 50ng per reaction input RNA. Shown are the fold changes measured following drug treatment compared to DMSO controls, as calculated using the ΔΔC(t) method. Error bars represent ± SEM from three independent experiments with n = 7 human subjects, n = 6 rhesus subjects, and n = 4 squirrel monkeys subjects.

Similar articles

Cited by

References

    1. Sardiello M, Cairo S, Fontanella B, Ballabio A, Meroni G (2008) Genomic analysis of the TRIM family reveals two groups of genes with distinct evolutionary properties. BMC Evol Biol 8: 225. - PMC - PubMed
    1. Boudinot P, van der Aa LM, Jouneau L, Du Pasquier L, Pontarotti P, et al. (2011) Origin and evolution of TRIM proteins: new insights from the complete TRIM repertoire of zebrafish and pufferfish. PloS one 6: e22022. - PMC - PubMed
    1. Han K, Lou DI, Sawyer SL (2011) Identification of a genomic reservoir for new TRIM genes in primate genomes. PLoS genetics 7: e1002388. - PMC - PubMed
    1. Sawyer SL, Emerman M, Malik HS (2007) Discordant evolution of the adjacent antiretroviral genes TRIM22 and TRIM5 in mammals. PLoS Pathog 3: e197. - PMC - PubMed
    1. Sawyer SL, Wu LI, Emerman M, Malik HS (2005) Positive selection of primate TRIM5alpha identifies a critical species-specific retroviral restriction domain. Proc Natl Acad Sci U S A 102: 2832–2837. - PMC - PubMed

Publication types

MeSH terms

Associated data