

Systems biology elucidates common pathogenic mechanisms between nonalcoholic and alcoholic-fatty liver disease
- PMID: 23516571
- PMCID: PMC3596348
- DOI: 10.1371/journal.pone.0058895
Systems biology elucidates common pathogenic mechanisms between nonalcoholic and alcoholic-fatty liver disease
Abstract
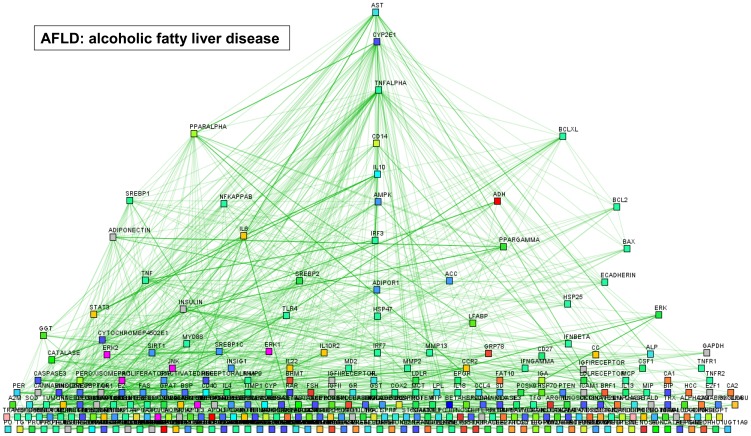
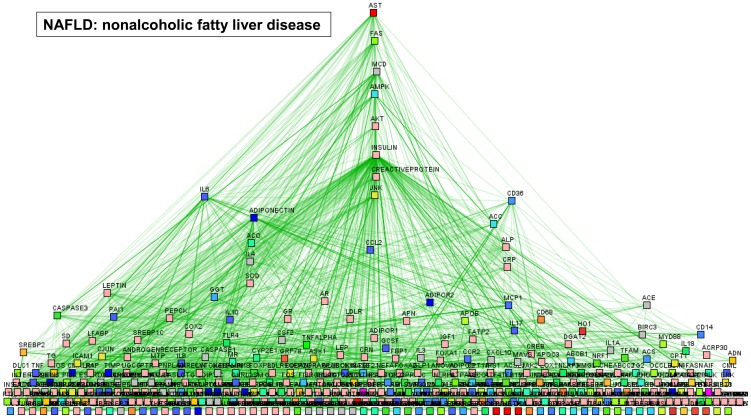
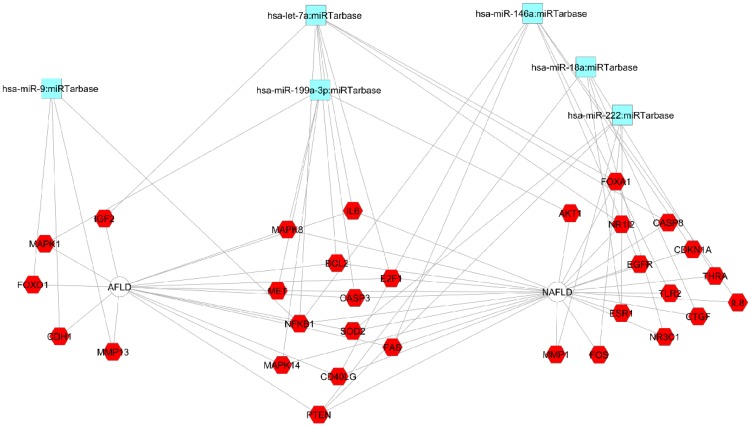
The abnormal accumulation of fat in the liver is often related either to metabolic risk factors associated with metabolic syndrome in the absence of alcohol consumption (nonalcoholic fatty liver disease, NAFLD) or to chronic alcohol consumption (alcoholic fatty liver disease, AFLD). Clinical and histological studies suggest that NAFLD and AFLD share pathogenic mechanisms. Nevertheless, current data are still inconclusive as to whether the underlying biological process and disease pathways of NAFLD and AFLD are alike. Our primary aim was to integrate omics and physiological data to answer the question of whether NAFLD and AFLD share molecular processes that lead to disease development. We also explored the extent to which insulin resistance (IR) is a distinctive feature of NAFLD. To answer these questions, we used systems biology approaches, such as gene enrichment analysis, protein-protein interaction networks, and gene prioritization, based on multi-level data extracted by computational data mining. We observed that the leading disease pathways associated with NAFLD did not significantly differ from those of AFLD. However, systems biology revealed the importance of each molecular process behind each of the two diseases, and dissected distinctive molecular NAFLD and AFLD-signatures. Comparative co-analysis of NAFLD and AFLD clarified the participation of NAFLD, but not AFLD, in cardiovascular disease, and showed that insulin signaling is impaired in fatty liver regardless of the noxa, but the putative regulatory mechanisms associated with NAFLD seem to encompass a complex network of genes and proteins, plausible of epigenetic modifications. Gene prioritization showed a cancer-related functional map that suggests that the fatty transformation of the liver tissue is regardless of the cause, an emerging mechanism of ubiquitous oncogenic activation. In conclusion, similar underlying disease mechanisms lead to NAFLD and AFLD, but specific ones depict a particular disease signature that has a different impact on the systemic context.
Conflict of interest statement
Figures


References
-
- Chalasani N, Younossi Z, Lavine JE, Diehl AM, Brunt EM, et al. (2012) The diagnosis and management of non-alcoholic fatty liver disease: practice Guideline by the American Association for the Study of Liver Diseases, American College of Gastroenterology, and the American Gastroenterological Association. Hepatology 55: 2005–2023 doi: 10.1002/hep.25762. - DOI - PubMed
-
- O'Shea RS, Dasarathy S, McCullough AJ (2010) Alcoholic liver disease. Hepatology 51: 307–328 10.1002/hep.23258 . - DOI - PubMed
-
- Kleiner DE, Brunt EM (2012) Nonalcoholic fatty liver disease: pathologic patterns and biopsy evaluation in clinical research. Semin Liver Dis 32: 3–13 10.1055/s-0032-1306421. - DOI - PubMed
-
- Lefkowitch JH (2005) Morphology of alcoholic liver disease. Clin Liver Dis 9: 37–53 doi:1016/j.cld.2004.11.001. - PubMed
-
- Ludwig J, Viggiano TR, McGill DB, Oh BJ (1980) Nonalcoholic steatohepatitis: Mayo Clinic experiences with a hitherto unnamed disease. Mayo Clin Proc 55: 434–438. - PubMed
Publication types
MeSH terms
Substances
LinkOut - more resources
Full Text Sources
Other Literature Sources
Medical
