

Bioengineered 3D human kidney tissue, a platform for the determination of nephrotoxicity
- PMID: 23516613
- PMCID: PMC3597621
- DOI: 10.1371/journal.pone.0059219
Bioengineered 3D human kidney tissue, a platform for the determination of nephrotoxicity
Erratum in
- PLoS One. 2013;8(10). doi:10.1371/annotation/fb32f1b8-7397-40be-bbf9-b80e67763043
Abstract
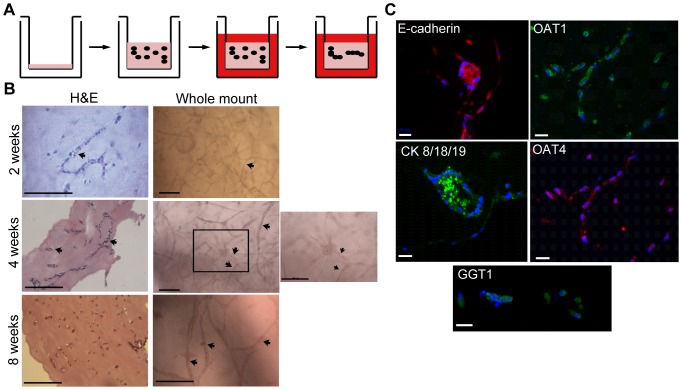
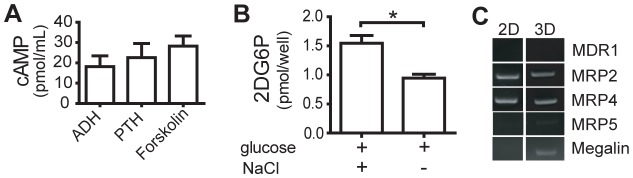
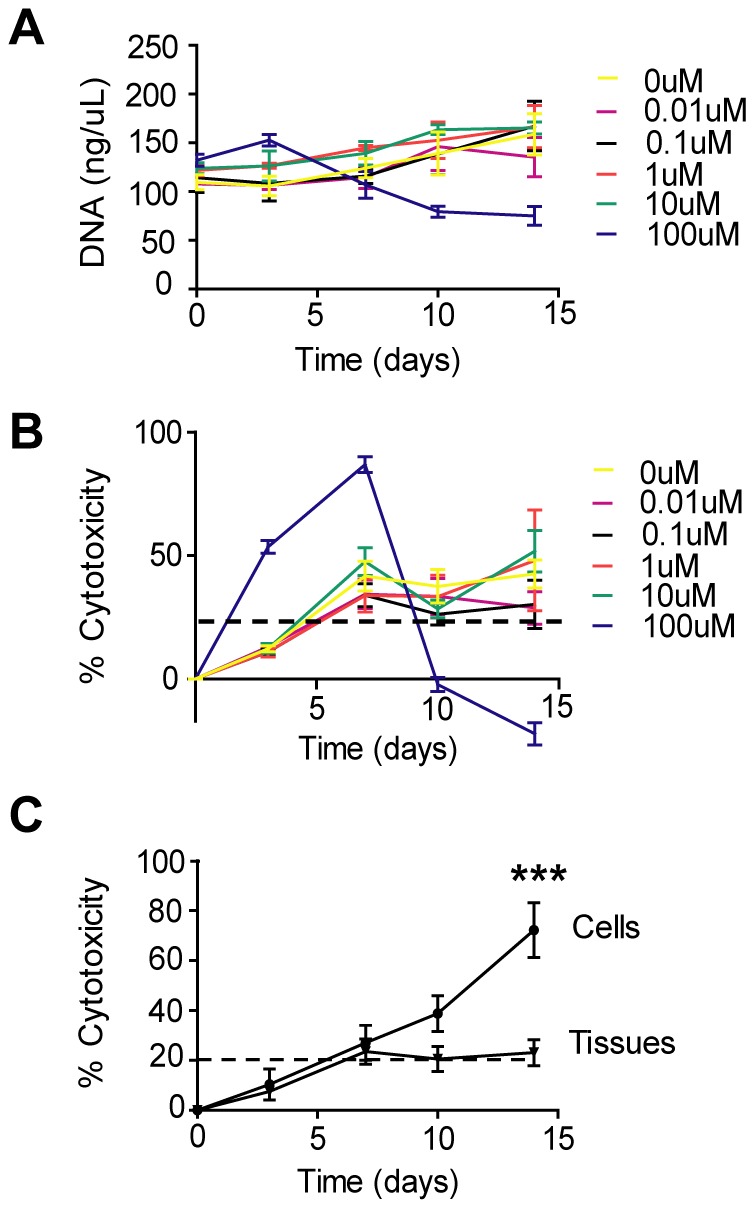
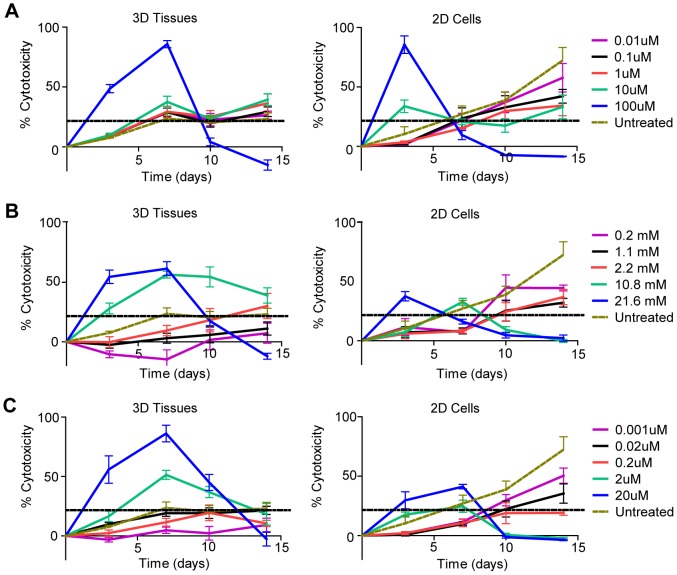
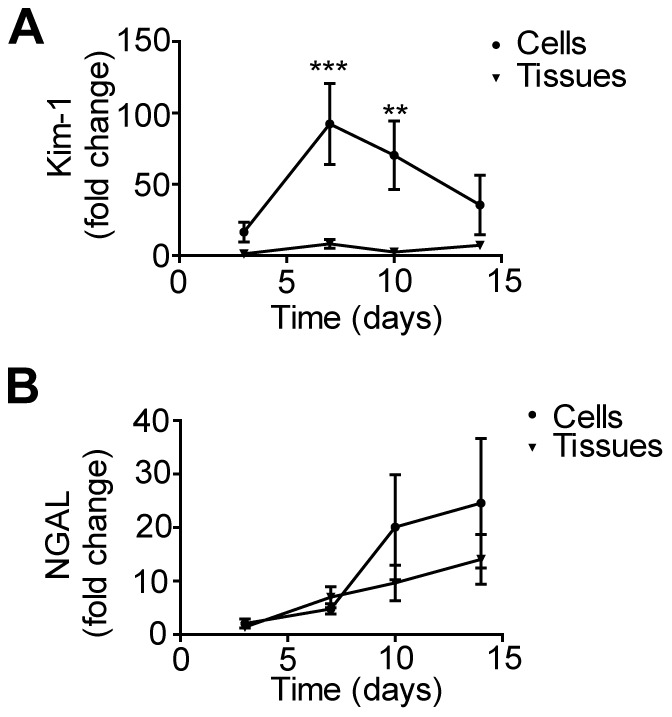
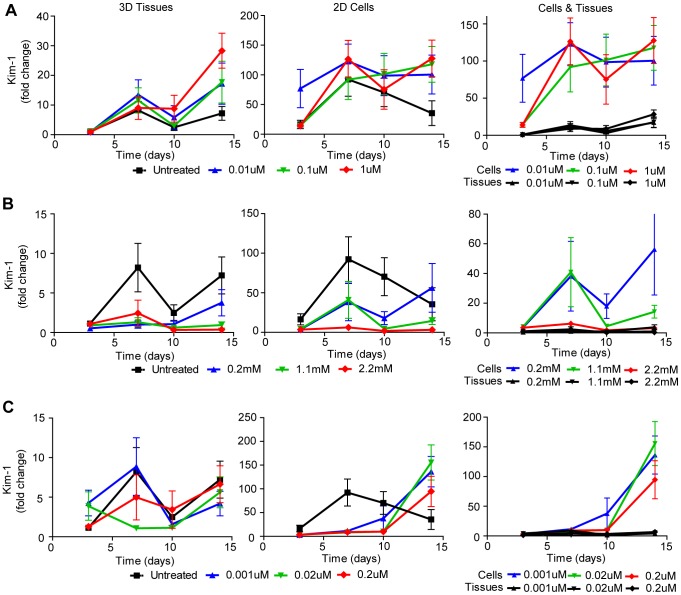
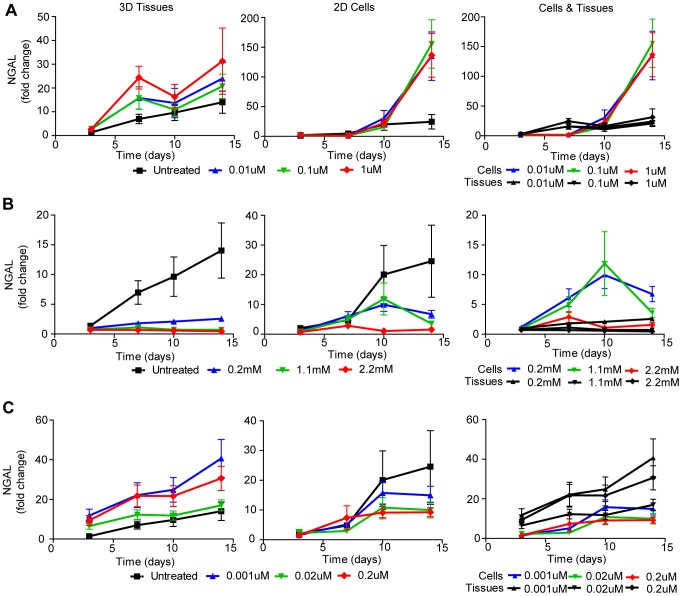
The staggering cost of bringing a drug to market coupled with the extremely high failure rate of prospective compounds in early phase clinical trials due to unexpected human toxicity makes it imperative that more relevant human models be developed to better predict drug toxicity. Drug-induced nephrotoxicity remains especially difficult to predict in both pre-clinical and clinical settings and is often undetected until patient hospitalization. Current pre-clinical methods of determining renal toxicity include 2D cell cultures and animal models, both of which are incapable of fully recapitulating the in vivo human response to drugs, contributing to the high failure rate upon clinical trials. We have bioengineered a 3D kidney tissue model using immortalized human renal cortical epithelial cells with kidney functions similar to that found in vivo. These 3D tissues were compared to 2D cells in terms of both acute (3 days) and chronic (2 weeks) toxicity induced by Cisplatin, Gentamicin, and Doxorubicin using both traditional LDH secretion and the pre-clinical biomarkers Kim-1 and NGAL as assessments of toxicity. The 3D tissues were more sensitive to drug-induced toxicity and, unlike the 2D cells, were capable of being used to monitor chronic toxicity due to repeat dosing. The inclusion of this tissue model in drug testing prior to the initiation of phase I clinical trials would allow for better prediction of the nephrotoxic effects of new drugs.
Conflict of interest statement
Figures


Similar articles
-
In vitro evaluation of biomarkers for cisplatin-induced nephrotoxicity using HK-2 human kidney epithelial cells.Toxicol Lett. 2013 Mar 13;217(3):235-42. doi: 10.1016/j.toxlet.2012.12.015. Epub 2012 Dec 31. Toxicol Lett. 2013. PMID: 23287709
-
A murine ex vivo 3D kidney proximal tubule model predicts clinical drug-induced nephrotoxicity.Arch Toxicol. 2019 May;93(5):1349-1364. doi: 10.1007/s00204-019-02430-9. Epub 2019 Mar 12. Arch Toxicol. 2019. PMID: 30863989
-
Caspase 3/GSDME-dependent pyroptosis contributes to chemotherapy drug-induced nephrotoxicity.Cell Death Dis. 2021 Feb 15;12(2):186. doi: 10.1038/s41419-021-03458-5. Cell Death Dis. 2021. PMID: 33589596 Free PMC article.
-
Cell- and biomarker-based assays for predicting nephrotoxicity.Expert Opin Drug Metab Toxicol. 2014 Dec;10(12):1621-35. doi: 10.1517/17425255.2014.967681. Epub 2014 Nov 10. Expert Opin Drug Metab Toxicol. 2014. PMID: 25382677 Review.
-
Earlier recognition of nephrotoxicity using novel biomarkers of acute kidney injury.Clin Toxicol (Phila). 2011 Oct;49(8):720-8. doi: 10.3109/15563650.2011.615319. Clin Toxicol (Phila). 2011. PMID: 21970770 Review.
Cited by
-
Zebrafish: A marvel of high-throughput biology for 21st century toxicology.Curr Environ Health Rep. 2014 Sep 7;1(4):341-352. doi: 10.1007/s40572-014-0029-5. Curr Environ Health Rep. 2014. PMID: 25678986 Free PMC article.
-
Kidney Disease Modeling with Organoids and Organs-on-Chips.Annu Rev Biomed Eng. 2024 Jul;26(1):383-414. doi: 10.1146/annurev-bioeng-072623-044010. Epub 2024 Jun 20. Annu Rev Biomed Eng. 2024. PMID: 38424088 Free PMC article. Review.
-
Bioprinting of 3D Convoluted Renal Proximal Tubules on Perfusable Chips.Sci Rep. 2016 Oct 11;6:34845. doi: 10.1038/srep34845. Sci Rep. 2016. PMID: 27725720 Free PMC article.
-
Evolving technology: creating kidney organoids from stem cells.AIMS Bioeng. 2016;3(3):305-318. doi: 10.3934/bioeng.2016.3.305. Epub 2016 Jul 25. AIMS Bioeng. 2016. PMID: 28393110 Free PMC article.
-
Anti-Cancer Drug Validation: the Contribution of Tissue Engineered Models.Stem Cell Rev Rep. 2017 Jun;13(3):347-363. doi: 10.1007/s12015-017-9720-x. Stem Cell Rev Rep. 2017. PMID: 28233276 Review.
References
-
- Dimasi JA, Hansen RW, Grabowski HG (2003) The price of innovation: new estimates of drug development costs. J Health Econ 22: 151–85. - PubMed
-
- Food and Drug Administration. (2004) Innovation or Stagnation: Challenge and opportunity on the critical path to new medical products.
-
- Pannu N, Nadim MK (2008) An overview of drug-induced acute kidney injury. Crit Care Med 36: S216–S223. - PubMed
-
- Chen JC, Stevens JL, Trifillis AL, Jones TW (1990) Renal cysteine conjugate beta-lyase-mediated toxicity studied with primary cultures of human proximal tubular cells. Toxicol Appl Pharmacol 103: 463–473. - PubMed
Publication types
MeSH terms
Substances
Grants and funding
LinkOut - more resources
Full Text Sources
Other Literature Sources
Miscellaneous
