. 2013 May 15;269(1):61-71.
doi: 10.1016/j.taap.2013.03.006. Epub 2013 Mar 19.

Epithelial-mesenchymal transition during oncogenic transformation induced by hexavalent chromium involves reactive oxygen species-dependent mechanism in lung epithelial cells

Affiliations

Epithelial-mesenchymal transition during oncogenic transformation induced by hexavalent chromium involves reactive oxygen species-dependent mechanism in lung epithelial cells

Song-Ze Ding et al. Toxicol Appl Pharmacol. .

Abstract

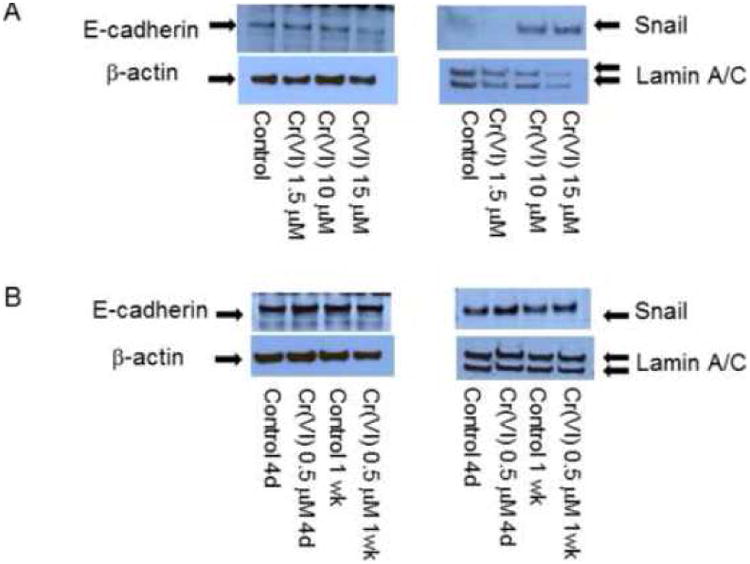
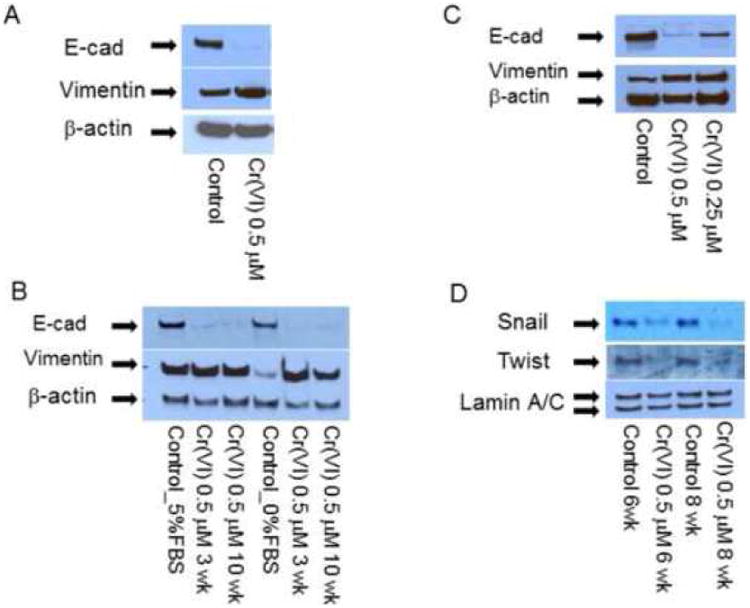
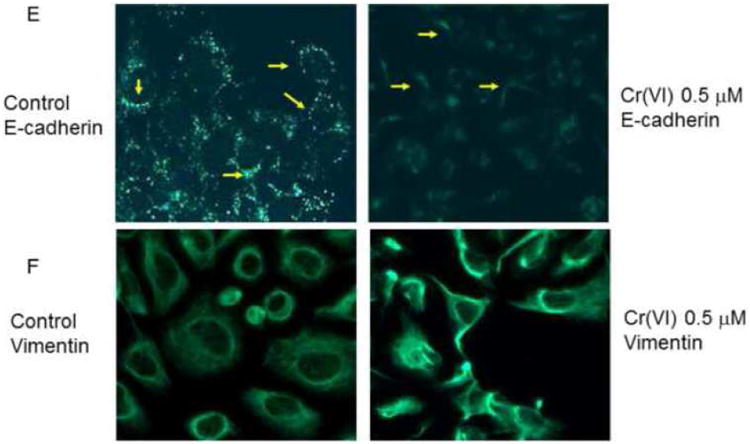
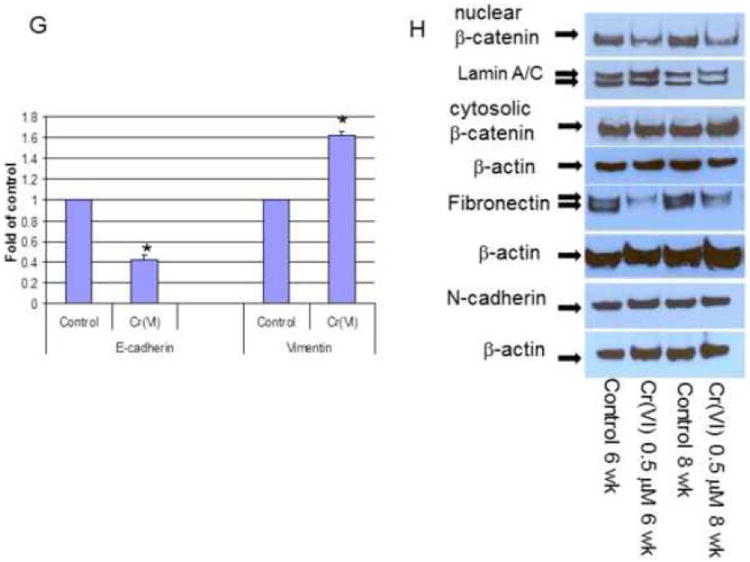
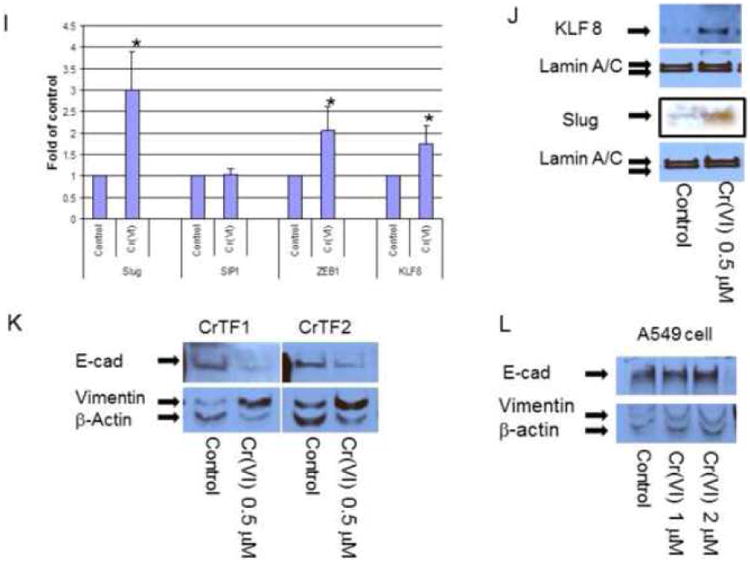
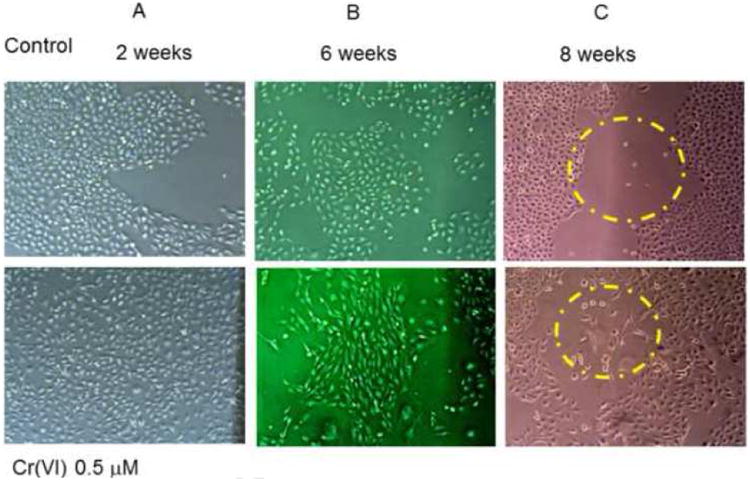
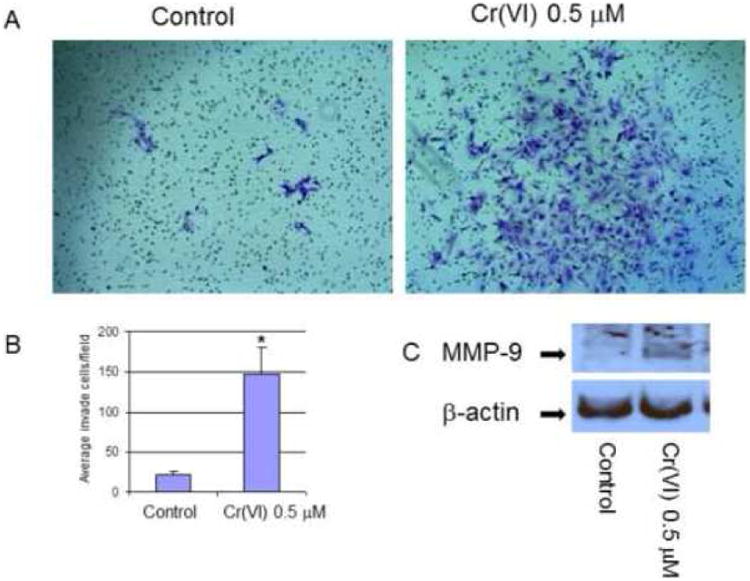
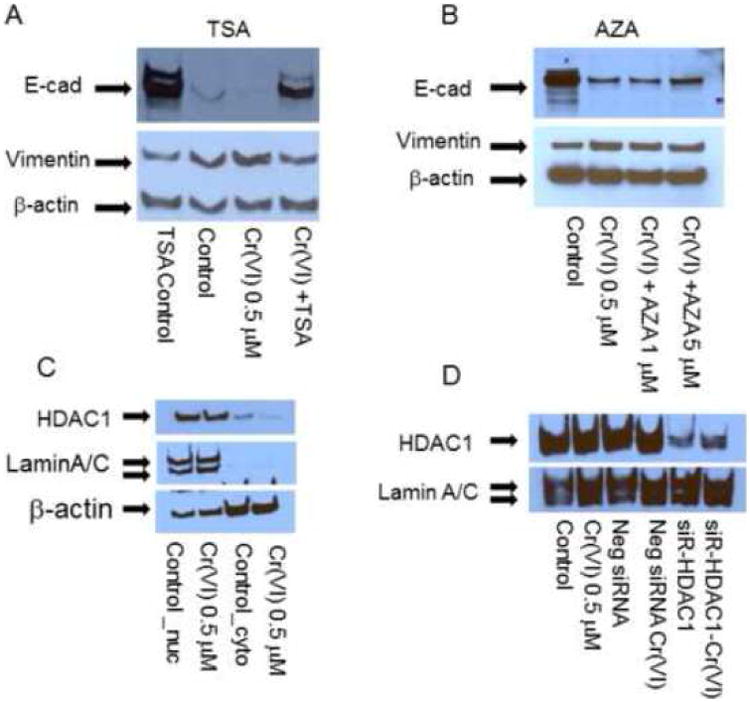
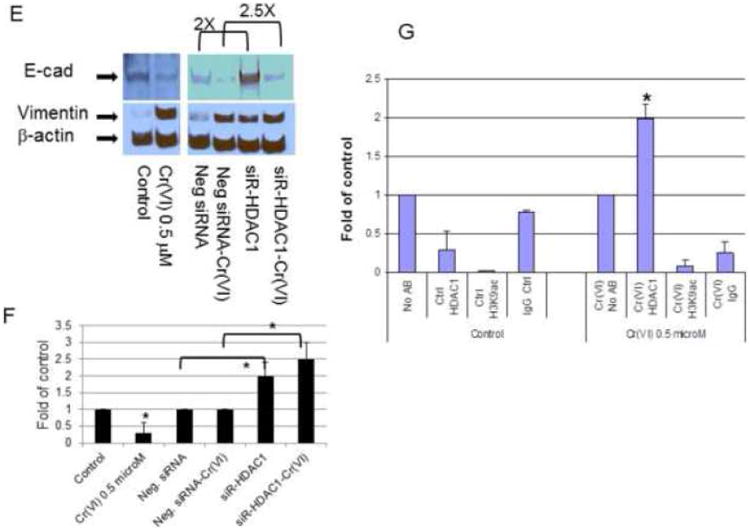
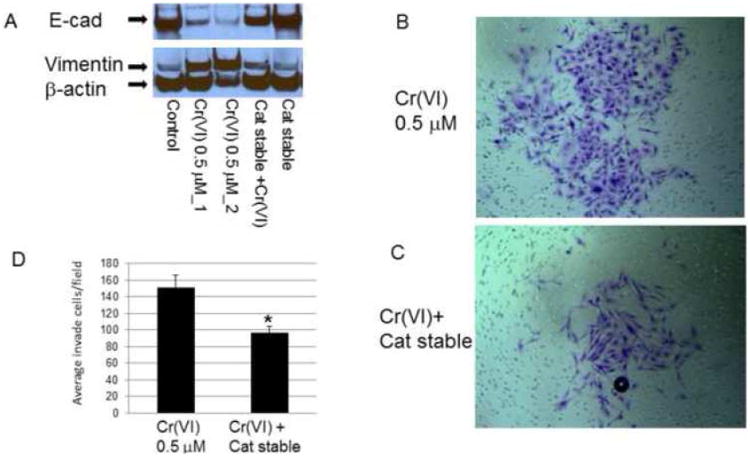
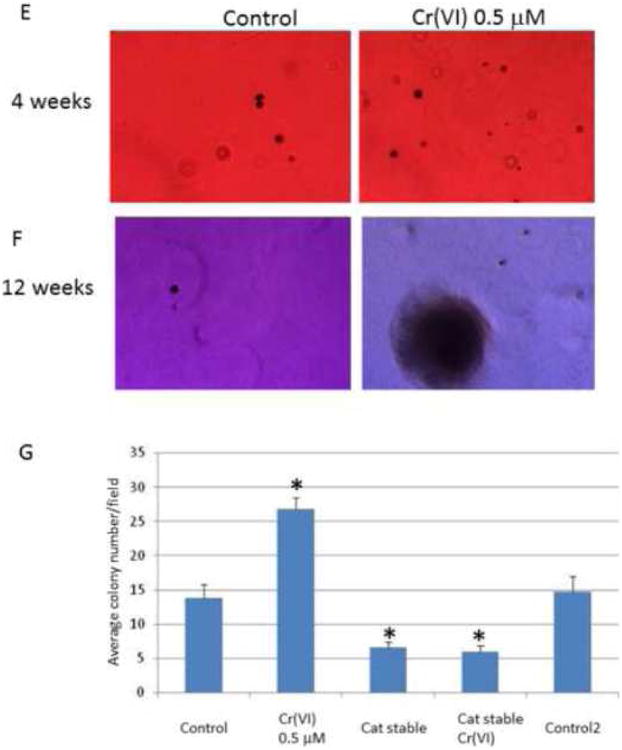
Hexavalent chromium [Cr(VI)] is an important human carcinogen associated with pulmonary diseases and lung cancer. Exposure to Cr(VI) induces DNA damage, cell morphological change and malignant transformation in human lung epithelial cells. Despite extensive studies, the molecular mechanisms remain elusive, it is also not known if Cr(VI)-induced transformation might accompany with invasive properties to facilitate metastasis. We aimed to study Cr(VI)-induced epithelial-mesenchymal transition (EMT) and invasion during oncogenic transformation in lung epithelial cells. The results showed that Cr(VI) at low doses represses E-cadherin mRNA and protein expression, enhances mesenchymal marker vimentin expression and transforms the epithelial cell into fibroblastoid morphology. Cr(VI) also increases cell invasion and promotes colony formation. Further studies indicated that Cr(VI) uses multiple mechanisms to repress E-cadherin expression, including activation of E-cadherin repressors such as Slug, ZEB1, KLF8 and enhancement the binding of HDAC1 in E-cadherin gene promoter, but DNA methylation is not responsible for the loss of E-cadherin. Catalase reduces Cr(VI)-induced E-cadherin and vimentin protein expression, attenuates cell invasion in matrigel and colony formation on soft agar. These results demonstrate that exposure to a common human carcinogen, Cr(VI), induces EMT and invasion during oncogenic transformation in lung epithelial cells and implicate in cancer metastasis and prevention.


Conflict of interest statement

Conflict of interest: The authors declare that there are no conflicts of interest.

Figures

Figure 1
Figure 1. Expression of E-cadherin and its suppressor after acute chromium exposure
BEAS-2B cells (1 × 10⁶) were treated with medium alone, Cr(VI) at 1.5, 10, 15 μM for 10 hours (A) and 0.5 μM for up to 1 week (B). Cells were washed, cytosolic and nuclear proteins were extracted and separated on 10% SDS-polyacrylamide gel to detect E-cadherin (E-cad) or Snail protein expression. Blots are representative of three separate experiments with similar results, arrows indicate specific band.
Figure 2
Figure 2. Chronic chromium exposure represses E-cadherin and enhances vimentin protein expression
To evaluate E-cadherin related protein expression, BEAS-2B cells were treated with or without Cr(VI) at 0.5 μM for 3-10 weeks (A-J). Cytosolic and nuclear proteins were extracted and separated on 10% SDS-polyacrylamide gel to detect E-cadherin (E-cad), vimentin, Snail, Twist, β-catenin, N-cadherin, fibronectin, krupple-like factor 8 (KLF 8) and Slug protein expression (A-D, H, J). Blots are representative of three separate experiments with similar results, arrows indicate specific band. For immunofluorescence staining of E-cadherin and vimentin, cells were seeded at 1 × 10⁴ in 8 well chamber, fixed with 1% formalin, washed and stained with E-cadherin and vimentin antibody overnight at 4°C. After washing and secondary antibody conjugation, cells were visualized with immunofluorescence microscope (E, F). For gene expression assay, total RNA was collected from above cells and real-time PCR was performed to detected E-cadherin, vimentin, Slug, SIP1, ZEB1 and KLF8 mRNA expression (G, I). Data are mean±SEM from three separate experiments, *P<0.01 when compared with controls. To determine E-cadherin and vimentin protein expression in tumor cells, CrTF1, CrTF2 and A549 cells were treated with or without Cr(VI) at 0.5 μM for 3 weeks, cell lysates were extracted to detect E-cadherin and vimentin protein expression (K, L) as described above.
Figure 3
Figure 3. Chromium induces BEAS-2B cell sequential morphological changes
BEAS-2B cells cultured in 100 mm dishes were treated with or without Cr(VI) at 0.5 μM for 3, 6 and 8 weeks. Cells growth and morphology changes were monitored and recorded under microscope throughout the experimental period. Photos are representative of 3-5 sets assays.
Figure 4
Figure 4. Chromium induces BEAS-2B cell invasion
For invasion assay, cells were treated with or without Cr(VI) at 0.5 μM for 6 weeks. 1 × 10⁵ cells from each group were seeded on the top chamber of 24-well plate culture inserts coated with 20 μl of matrigel in duplicate. Cells were cultured for additional 72 hours, invaded cells on the bottom of insert were stained, photographed, and counted (A, B). Quantitative results were compared with control cells without Cr(VI) treatment, *P<0.01 when compared with control (B). For MMP-9 expression assay (C), cytosolic proteins were extracted from cells that were treated as mentioned above, 20 μg of proteins were separated on 10% SDS-polyacrylamide gel to detect MMP-9 expression, anti-β-actin antibody was probed to monitor protein loading. Blots are representative of three separate experiments with similar results, arrows indicate specific band.
Figure 5
Figure 5. HDAC1 inhibition on Cr(VI)-induced E-cadherin and vimentin expression
For inhibitor assay, BEAS-2B cells (5 × 10⁵) treated with or without Cr(VI) at 0.5 μM for 6 weeks were seeded in 60 mm dishes. Trichostatin A (TSA, 0.1 μM), 5-aza-2′-deoxycytidine (AZA, 1-5 μM) were added for 24 hours prior to cellular protein extraction to evaluate E-cadherin (E-cad)/vimentin protein expression (A, B). For siRNA transfection assay (C-F), BEAS-2B cells (2.5 × 10⁵) were treated as mentioned above and seeded in 6-well plates. siRNA for HDAC1 and negative control (siR-HDAC1, Neg siRNA) were transfected with Lipofectamine 2000. Nuclear and cytosolic proteins were extracted 48 hours post transfection to evaluate E-cadherin, vimentin protein expression. Blots are representative of three separate experiments with similar results, arrows indicate specific band. Densitometry data are expressed as arbitrary unit and adjusted as fold changes over the control (Fig. 5F), *P<0.05 when compared with their respective controls. ChIP assay and quantitative RT-PCR were performed as described in Materials and Methods. qRT-PCR were performed from input and ChIP material (IP) to detected the relative promoter binding of HDAC1 in E-cadherin promoter, GAPDH served as control. Data represent IP/GAPDH ratio and are adjusted as fold changes over no antibody control (No Ab). Results are mean±SEM from 3 separate experiments, *P<0.01 when compared to the controls (G).
Figure 6
Figure 6. Catalase reduces Cr(VI)-induced E-cadherin suppression, invasion and oncogenic transformation in BEAS-2B cells
For protein expression assay, BEAS-2B and BEAS-2B-catalase-stably expressing (Cat stable) cells (1 × 10⁶) were treated with or without Cr(VI) for 3 weeks. Cytosolic and nuclear proteins were extracted and separated on 10% SDS-polyacrylamide gel to determine E-cadherin (E-cad) and vimentin expression (A). Blots are representative of three separate experiments with similar results, arrows indicate specific band. For invasion assay (B-D), BEAS-2B and BEAS-2B-catalase-stably expressing (Cat stable) cells were treated with or without Cr(VI) 0.5 μM for 6 weeks and seeded in matrigel chamber as described in Fig 4. For colony formation assay, BEAS-2B and BEAS-2B-catalase-stably expressing (Cat stable) cells (2.5 × 10³) (E-G) treated with or without Cr(VI) for 8 weeks, and plated in 0.35% soft agar in duplicate in 10% FBS DMEM media for additional 4-12 weeks to allow colony formation. Colony numbers from 12 weeks group was determined in each well and compared with controls (F). Data are mean±SEM from three separate experiments, *P<0.01 when compared with controls.

Similar articles

Cited by

References

    1. Batlle E, Sancho E, Franci C, Dominguez D, Monfar M, Baulida J, Garcia De Herreros A. The transcription factor snail is a repressor of E-cadherin gene expression in epithelial tumour cells. Nat Cell Biol. 2000;2:84–89. - PubMed
    1. Beaver LM, Stemmy EJ, Constant SL, Schwartz A, Little LG, Gigley JP, Chun G, Sugden KD, Ceryak SM, Patierno SR. Lung injury, inflammation and Akt signaling following inhalation of particulate hexavalent chromium. Toxicol Appl Pharmacol. 2009;235:47–56. - PMC - PubMed
    1. Berx G, Cleton-Jansen AM, Nollet F, de Leeuw WJ, van de Vijver M, Cornelisse C, van Roy F. E-cadherin is a tumour/invasion suppressor gene mutated in human lobular breast cancers. EMBO J. 1995;14:6107–6115. - PMC - PubMed
    1. Bolos V, Peinado H, Perez-Moreno MA, Fraga MF, Esteller M, Cano A. The transcription factor Slug represses E-cadherin expression and induces epithelial to mesenchymal transitions: a comparison with Snail and E47 repressors. J Cell Sci. 2003;116:499–511. - PubMed
    1. Borges KM, Wetterhahn KE. Chromium cross-links glutathione and cysteine to DNA. Carcinogenesis. 1989;10:2165–2168. - PubMed

Publication types

MeSH terms