. 2013 Mar 18;23(3):332-46.
doi: 10.1016/j.ccr.2013.02.016.

The E3 ubiquitin ligase Siah2 contributes to castration-resistant prostate cancer by regulation of androgen receptor transcriptional activity

Affiliations

The E3 ubiquitin ligase Siah2 contributes to castration-resistant prostate cancer by regulation of androgen receptor transcriptional activity

Jianfei Qi et al. Cancer Cell. .

Erratum in

  • Cancer Cell. 2013 Jun 10;23(6):853. Fazil, Ladan [corrected to Fazli, Ladan]

Abstract

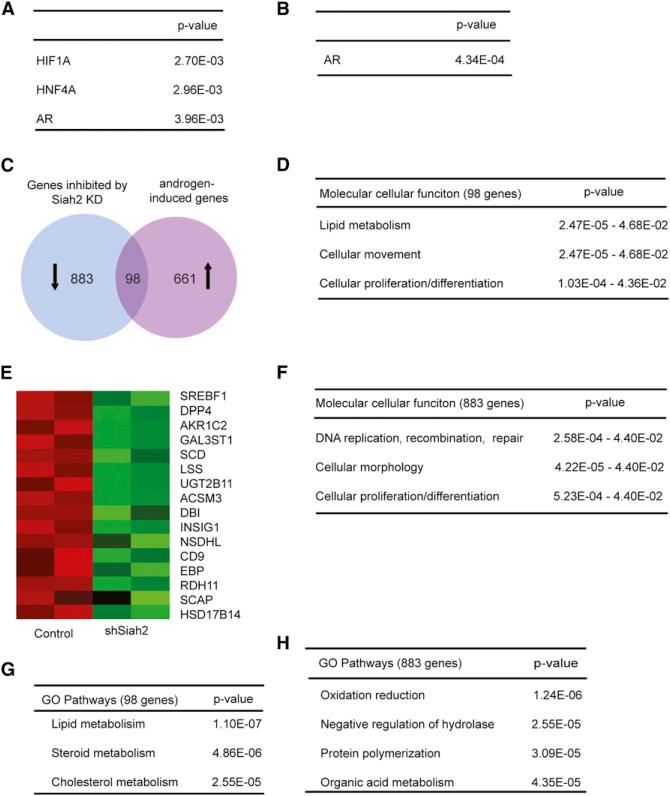
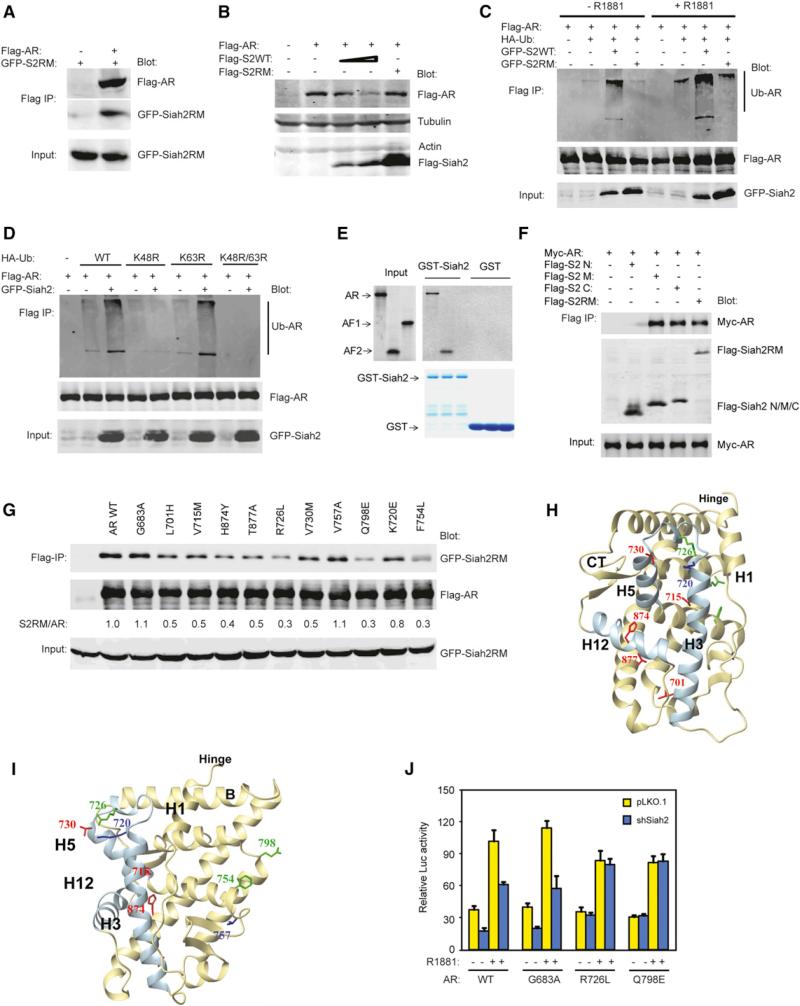
Understanding the mechanism underlying the regulation of the androgen receptor (AR), a central player in the development of castration-resistant prostate cancer (CRPC), holds promise for overcoming the challenge of treating CRPC. We demonstrate that the ubiquitin ligase Siah2 targets a select pool of NCOR1-bound, transcriptionally-inactive AR for ubiquitin-dependent degradation, thereby promoting expression of select AR target genes implicated in lipid metabolism, cell motility, and proliferation. Siah2 is required for prostate cancer cell growth under androgen-deprivation conditions in vitro and in vivo, and Siah2 inhibition promotes prostate cancer regression upon castration. Notably, Siah2 expression is markedly increased in human CRPCs. Collectively, we find that selective regulation of AR transcriptional activity by the ubiquitin ligase Siah2 is important for CRPC development.


Figures

Figure 1
Figure 1. Siah2 Is Required for the Castration Sensitivity and Expression of Select AR Targets in the TRAMP Atypical Hyperplasia Model
(A) H&E staining of AH in the dorsal prostates of Siah2+/+;TRAMP or Siah2–/–;TRAMP mice before and after castration. (B) The scatter plot showing the average weight of dorsal prostates micro-dissected from 5-month-old mice with or without 3-week castration (n = 10 for each group). p = 0.17 for WT versus Siah KO, – castration; p < 0.005 for WT versus Siah KO, + castration. (C) Transcript levels of selected AR target genes in the prostates of Siah2–/–;TRAMP mice after castration. RNA for qRT-PCR was isolated from the dorsal prostates of 5-month-old mice with 3 week castration. p < 0.01 for NKX3.1, p < 0.005 for SPINK3, p < 0.05 for SBP, p > 0.1 for TMPRSS2, probasin, or CK8. Data are mean ± SD. See also Figure S1.
Figure 2
Figure 2. Siah2 Is Required for the Expression of Select AR Targets in Human Prostate Cancer Cells
(A) Effect of Siah2 knockdown in LNCaP cells on the PSA transcript levels. Siah2 was knocked down in LNCaP cells using four different Siah2 shRNAs. LNCaP transfectants were grown in medium containing 5% CS-FBS for 48 hr before treatment with 0.5 nM or 10 nM of synthetic androgen R1881 for 16 hr. The differences in PSA transcript levels between Siah2-knockdown and pLKO.1-transfected control cells were statistically significant (p < 0.005) in the presence and absence of androgen. (B) Effect of Siah2 knockdown in Rv1 cells on the PSA transcript levels under normoxia or hypoxia. Rv1 cells transfected with Siah2 shRNA were grown in medium containing 5% CS-FBS for 48 hr and then treated for 16 hr with or without hypoxia or 10 nM R1881. Hypoxia did not increase the PSA transcript level in either pLKO.1 control or Siah2-knockdown cells (p > 0.1). N, normoxia; H, hypoxia. (C) Effect of Siah2 knockdown in LNCaP cells on the PSA transcript levels under normoxia or hypoxia. The analysis was performed as for (B). (D) qRT-PCR analysis of the indicated AR target genes in LNCaP cells transfected with shSiah2 or shAR vectors. Reduction in transcripts of PSA, NKX3.1, PMEPA1, and SLC45A3 by shSiah2 or shAR was statistically significant. Transcripts of TMPRSS2 or FKBP5 were reduced by shAR (p < 0.01) but not by shSiah2 (p > 0.1). (E) qRT-PCR analysis of the indicated AR target genes in Rv1 cells transfected with shSiah2 vector. Reduction in transcripts of PSA, NKX3.1, PMEPA1, and SLC45A3 by shSiah2 was statistically significant (p < 0.01). (F) qRT-PCR analysis of PSA transcripts in the indicated transfectants of LNCaP or Rv1 cells. The reduction of PSA transcript in the indicated knockdown cells was statistically significant (p < 0.0005). Data are mean ± SD. See also Figure S2.
Figure 3
Figure 3. Bioinformatic Analyses of Siah2-Dependent Genes in Rv1 Cells
(A) Top three transcription factors predicted to underlie Siah2-dependent transcription by IPA. A total of 981 genes downregulated upon Siah2 knockdown were subjected to IPA analysis against canonical gene pathways. (B) IPA analysis of transcription factors enriched within the 981 genes, as described in (A), against human prostate cancer cell data set. (C) Venn diagram depicting overlap between genes downregulated by Siah2 knockdown and those induced by androgen signaling. The androgen-induced ARGs in prostate cancer cells were extracted from an ARG data set. (D) The molecular and cellular functions of the 98 Siah2-dependent ARGs revealed by IPA analyses. (E) Heatmap of the Siah2-dependet ARGs that regulate biosynthesis and metabolism of lipid, cholesterol, and steroids. Upregulated genes, red; downregulated genes, green. (F) The molecular and cellular functions of the 883 genes (Siah2-dependent but AR-independent) revealed by IPA analyses. (G) DAVID GOBP analyses of pathways enriched in the 98 Siah2-dependent ARGs. (H) DAVID GOBP analyses of pathways enriched in the 833 genes (Siah2-dependent, but AR-independent). See also Figure S3 and Tables S1, S2, S3, S4, S5, and S6.
Figure 4
Figure 4. Siah2 Interacts with and Ubiquitinates AR for Proteasome-Dependent Degradation
(A) 293T cells were transfected with Flag-AR and GFP-Siah2RM for 24 hr before immunoprecipitation with anti-Flag M2 beads. Bound proteins were eluted and analyzed by western blotting with Flag or GFP antibodies. (B) 293T cells were transfected with Flag-tagged AR and Siah2 (WT or RM) for 24 hr. Whole cell lysates were analyzed by western blotting with the antibodies of Flag, tubulin, and actin. (C) 293T cells were transfected with Flag-AR, HA-Ub, and GFP-Siah2 (WT or RM) for 24 hr in the presence or absence of 10 nM R1881. Cells were treated with 20 μM MG132 for 5 hr and then Flag-AR was immunoprecipitated with M2 beads under denaturing conditions. The immunoprecipitates were analyzed by western blotting with HA or Flag antibody. The input of GFP-Siah2 was immunoblotted with GFP antibody. (D) 293T cells were transfected with Flag-AR, HA-Ub (WT, K48 mutant, K63 mutant, and K48/K63 double mutant), and GFP-Siah2. The analysis was performed as described for (C). (E) Flag-AF2 or-AF1 was in vitro translated (35S labeling), purified, and incubated with GST-Siah2. Proteins bound to GST-Siah2 were analyzed by SDS-PAGE and phosphoimaging. (F) Identification of the AR-interacting domains of Siah2. Myc-AR was cotransfected with Flag-tagged Siah2 fragments (N, N-terminal part; C, C-terminal part; M, middle part) in 293T cells. Siah2 fragments were immunoprecipitated with M2 beads and coprecipitated Myc-AR was analyzed by western blotting using Flag or AR antibody. (G) 293T cells were cotransfected with GFP-Siah2RM and Flag-AR mutants as indicated. After 24 hr, immunoprecipitation was performed using M2 beads and samples were analyzed by western blotting using GFP or Flag antibody. The intensity ratios between GFP-S2RM and Flag-ARs are shown. The input of GFP-Siah2RM is shown at the bottom panel. (H and I) Structural location of AR LBD mutants in WT AR. Ribbon presentation of the LBD with the AF2 site helices highlighted in blue and labeled in addition to the key helix H1 (H). The side chains of residues that were mutated are drawn as sticks, labeled, and colored green (strong), red (moderate), or blue (no effect) depending on their effect on Siah2 interaction. A 90° rotation of the model is shown to highlight the location of V757, F754, and Q798 (I). (J) PC3 cells (pLKO.1 or shSiah2) were cotransfected with a PSA promoter Gaussia luciferase construct, a control Cypridina luciferase construct, and the mutant ARs indicated. Cells were grown in medium containing 5% CS-FBS for 48 hr and treated with 1 nM of R1881 for 16 hr. Gaussia luciferase activity was normalized to the Cypridina luciferase activity (n = 3). Data are mean ± SD. Siah2 knockdown reduced PSA promoter activity in cells expressing WT AR or G683 mutant AR in the absence or presence of R1881 (p < 0.05). See also Figure S4.
Figure 5
Figure 5. Siah2 Promotes the AR Transcriptional Activity by Targeting the NCOR1-Bound AR
(A) LNCaP cells stably transfected with control, AR shRNA, or Siah2 shRNA were grown in the absence or presence of 1 nM of R1881 for 12 hr, treated with 20 μM MG132 for 5 hr, and collected for ChIP assays using an anti-Siah2 antibody. Purified chromatin was analyzed by qPCR for the ARE regions of PSA, NKX3.1, PMEPA1, and TMPRSS2. Siah2 was enriched on AREs of PSA, NKX3.1, and PMEPA1 in the presence of R1881 (p < 0.05), but not on the ARE of TMPRSS2 gene (p = 0.62). (B) Rv1 cells stably transfected with control, AR shRNA, or NCOR1 shRNA were grown in the normal growth medium, treated with 20 μM MG132 for 5 hr, and collected for the ChIP assays using anti-Siah2 antibody as described in (A). AR or NCOR1 knockdown affected Siah2 presence on the AREs of PSA, NKX3.1, and PMEPA1 (p < 0.05) and TMPRSS2 (p > 0.1). (C) Effect of Siah2 knockdown in LNCaP cells on the association of AR and NCOR1 with the PSA promoter. ChIP assays were performed on LNCaP cells (pLKO.1 or shSiah2) using anti-AR or anti-NCOR1 antibodies and purified chromatins were analyzed by qPCR for the ARE region of PSA gene. Relative change in AR (p < 0.05) or NCOR1 (p < 0.0005) in the presence of R1881 or upon knockdown of Siah2, or NCOR1 (p > 0.1) is shown. (D) Effect of Siah2 knockdown in Rv1 cells on the association of AR and NCOR1 with the AREs of PSA, NKX3.1 and PMEPA1. ChIP assays were performed on Rv1 cells (pLKO.1 control or shSiah2) using anti-AR or anti-NCOR1 antibodies and purified chromatins were analyzed by qPCR for ARE regions of PSA, NKX3.1, PMEPA1 and TMPRSS2. Level of AR (p < 0.05) and NCOR1 (p < 0.05) on the AREs of PSA, NKX3.1, and PMEPA1 upon Siah2 KD, compared with the ARE of TMPRSS2 (p > 0.1). (E) Effect of Siah2 knockdown in Rv1 cells on the association of ubiquitinated proteins with the AREs of PSA, NKX3.1, and PMEPA1. ChIP assays were performed on Rv1 cells (pLKO.1 control or shSiah2) using anti-ubiquitin antibody and analyzed as described in (D). Level of ubiquitinated proteins upon Siah2 KD on the ARE regions of PSA, NKX3.1, and PMEPA1 (p < 0.05), compared with the ARE on TMPRSS2 gene (p = 0.55). (F) 293T cells were transfected with Flag-AR or Flag-AR/myc-NCOR1, which were isolated by purification on M2 beads and then incubated with 293T lysates expressing GFP-Siah2RM. After three washes, the proteins were eluted and analyzed by western blotting using the antibodies of Flag, Myc or GFP. (G) qRT-PCR of the indicated genes was performed on Rv1 cells (pLKO.1 or shSiah2) transfected with NCOR1 siRNA. Shown is the change in transcripts of PSA, NKX3.1, and PMEPA1 in pLKO.1 or Siah2 KD cells by the NCOR1 siRNA (p < 0.05). (H) LNCaP cells were treated with 1 nM of R1881 for 12 hr, 20 μM MG132 for 5 hr, and collected for the first round of IP (ChIP) using Siah2 antibody. The eluates of the first IP were used for the second round of IP (reChIP) using antibodies indicated. The purified chromatins by the reChIP were analyzed by qPCR for the ARE region of PSA promoter. Relative enrichment by AR or NCOR1 antibody (p < 0.05), or p300 antibody (p = 0.76) is shown. (I) LNCaP cells were treated with 1 nM of R1881 for 12 hr, and collected for the first round of IP (ChIP) using p300 (left columns) or NCOR1 (right columns) antibody followed by the second round of IP (reChIP) using the antibodies indicated, and analyzed by qPCR for the ARE region of PSA gene. Enrichment of reChIP by AR antibody is shown (p < 0.05). (J) LNCaP cells subjected to NCOR1 or Siah2 KD were treated with 1 nM of R1881 for 12 hr, collected for the ChIP assays using p300 antibody, and analyzed by qPCR of the ARE region of PSA promoter. p300 enrichment upon NCOR1 or Siah2 KD (p < 0.05) is shown. (K) ChIP assays using acetylated histone H3 antibody were performed on LNCaP cells as described in J. Shown is the relative enrichment of acetylated histone H3 antibody on PSA promoter upon NCOR1 or Siah2 knockdown (p < 0.05). Data are mean ± SD. See also Figure S5.
Figure 6
Figure 6. The Siah2 Effect on AR for the Proliferation and Motility of PCa Cells
(A) Effect of Siah2 knockdown on the growth of human PCa cells. LNCaP, Rv1, PC3, or DU145 cells were stably transfected with Siah2 shRNA or control pLKO.1 vector. Equal numbers of cells (1 × 10⁴) were seeded in 12-well plates in medium containing 5% FBS (+androgen) or 5% CS-FBS (–androgen) and cells were counted after 5 days (n = 3). Change in cell growth upon Siah2 KD in LNCaP or Rv1 cells was maintained in the presence or absence of androgen (p < 0.05). (B) Siah2 or AR was stably knocked down individually or in combination in LNCaP or Rv1 cells. Equal numbers of cells (5 × 10⁴) were grown in six-well plates and cells were counted after 5 days (n = 3). Change in growth of Rv1 (p < 0.01) or LNCaP (p < 0.005) is shown. (C) Knockdown of Siah2 or AR in Rv1 cells on the colony formation in soft agar assays. Cells (pKLO.1 control, shSiah2, or shAR) were maintained in soft agar for 3 weeks before staining with p-iodonitrotetrazolium violet. The number of colonies per field was quantified (p < 0.0001). (D) Siah2 or AR KD effect on colony formation of C4-2 cells (p < 0.00005), was carried out as detailed in (C). (E and F) Rv1 cells (pLKO.1, shSiah2, and shAR) were grown in the three-dimensional Matrigel in the presence (5% FBS) or absence (5% CS-FBS) of androgen for 1 week (E). The number of spheres (>25 μm in diameter) grown in the presence (p < 0.05) or absence (p < 0.005) of androgen is shown (F). Rv1 cells (pLKO.1, shSiah2, and shAR) were subjected to transwell assays in the presence (5% FBS; p < 0.0005) or absence (5% CS-FBS; p < 0.05) of androgen for 24 hr. (G) Migration of LNCaP cells upon KD of Siah2 or AR in the presence (p < 0.0005) or absence (p < 0.001) of androgen, monitored using the transwell assays as described in (F). Data are mean ± SD. See also Figure S6.
Figure 7
Figure 7. Siah2 Promotes the Growth of CRPC Orthotopic Tumors, and Its Expression Is Elevated in Human CRPC Samples
(A) Orthotopic tumor size of C4-2 cells expressing Siah2 shRNA with or without castration. C4-2 cells (pLKO.1 or shSiah2) were injected into the dorsal prostates of nude mice and 3 weeks later one group of mice was castrated for 4 weeks. The size of tumors formed was quantified (n = 6 for each group). p < 0.005 for pLKO.1, – castration versus shSiah2, – castration; p < 0.01 for shSiah2, – castration versus shSiah2, + castration; p = 0.16 for pLKO.1, – castration versus pLKO.1, + castration. (B) qRT-PCR analysis of the indicated genes on RNA samples extracted from the orthotopic tumors. Change in transcripts level for PSA, PMEPA1, SLC45A3, and CLGN upon Siah2 KD with or without castration (p < 0.05). (C) The phospho-histone and TUNEL staining on the MPC3 tumor tissues collected from the indicated mice after castration. MPC3 pLKO.1 cells or Siah2-KD cells were recombined with WT or Tgfr2 KO prostate stromal cells for an orthotopic injection. One month after injection, mice were castrated, and 4 days later tissues were collected and subjected to IHC analyses. (D) Quantification of phospho-histone and TUNEL staining shown in (C). (E) Representative images of Siah2 IHC staining on the PCa TMA. BPH, benign prostate hyperplasia. (F) Quantification of Siah2 IHC staining on the BPH and PCa samples of different Gleason scores. ANOVA with Tukey's multiple comparison indicates p < 0.0001, except Gleason3 versus Gleason5 (lower number of cases in Gleason5 group). (G) Quantification of Siah2 IHC staining on the PCa samples without or with ADT or the CRPC samples. ANOVA with posthoc results indicates p < 0.0001 for CRPC compared with all other groups and for untreated PCa compared with all other groups. (H) Quantification of Siah2 staining on the PCa samples after prostatectomy or ADT (with or without clinical recurrence). ANOVA analyses of Siah2 staining between recurrent and nonrecurrent cases in samples after ADT (p < 0.0001), and between recurrent and nonrecurrent cases in samples obtained after prostatectomy (p < 0.1). Data are mean ± SD. See also Figure S7 and Table S7.

References

    1. Bao BY, Chuang BF, Wang Q, Sartor O, Balk SP, Brown M, Kantoff PW, Lee GS. Androgen receptor mediates the expression of UDP-glucuronosyltransferase 2 B15 and B17 genes. Prostate. 2008;68:839–848. - PMC - PubMed
    1. Bhowmick NA, Chytil A, Plieth D, Gorska AE, Dumont N, Shappell S, Washington MK, Neilson EG, Moses HL. TGF-beta signaling in fibroblasts modulates the oncogenic potential of adjacent epithelia. Science. 2004;303:848–851. - PubMed
    1. Cai C, Chen S, Ng P, Bubley GJ, Nelson PS, Mostaghel EA, Marck B, Matsumoto AM, Simon NI, Wang H, et al. Intratumoral de novo steroid synthesis activates androgen receptor in castration-resistant prostate cancer and is upregulated by treatment with CYP17A1 inhibitors. Cancer Res. 2011;71:6503–6513. - PMC - PubMed
    1. Calzado MA, de la Vega L, Möller A, Bowtell DD, Schmitz ML. An inducible autoregulatory loop between HIPK2 and Siah2 at the apex of the hypoxic response. Nat. Cell Biol. 2009;11:85–91. - PubMed
    1. Chiaverotti T, Couto SS, Donjacour A, Mao JH, Nagase H, Cardiff RD, Cunha GR, Balmain A. Dissociation of epithelial and neuroendocrine carcinoma lineages in the transgenic adenocarcinoma of mouse prostate model of prostate cancer. Am. J. Pathol. 2008;172:236–246. - PMC - PubMed

Publication types

MeSH terms

Associated data