. 2013 Mar 18;23(3):362-75.
doi: 10.1016/j.ccr.2013.01.025.

Regulation of c-Myc ubiquitination controls chronic myelogenous leukemia initiation and progression

Affiliations

Regulation of c-Myc ubiquitination controls chronic myelogenous leukemia initiation and progression

Linsey Reavie et al. Cancer Cell. .

Abstract

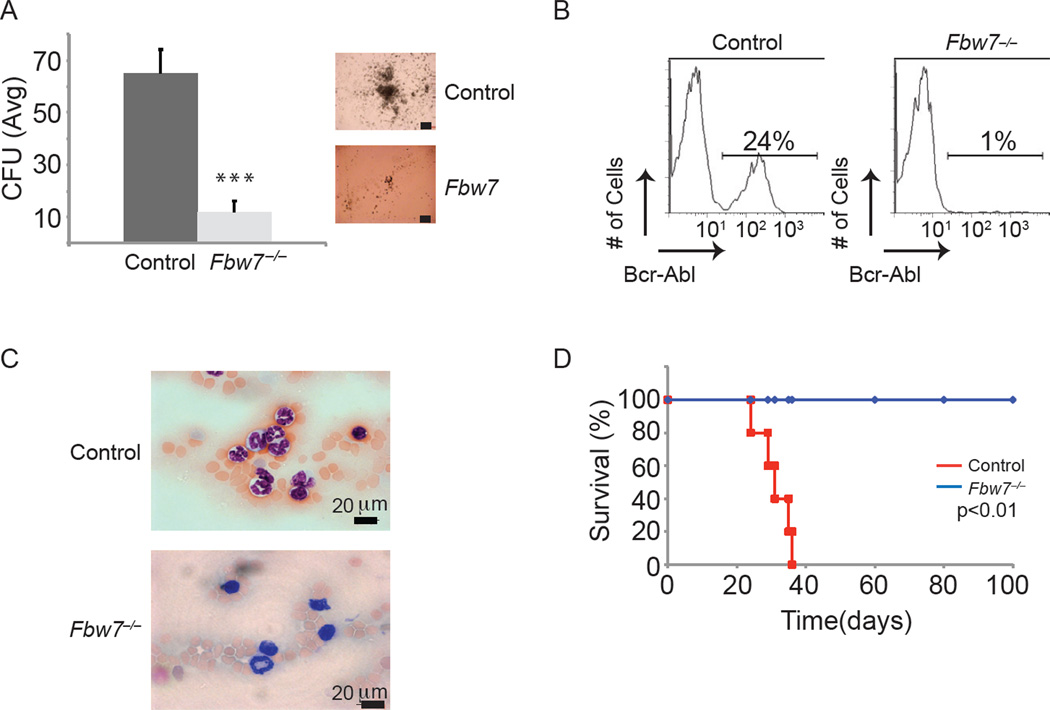
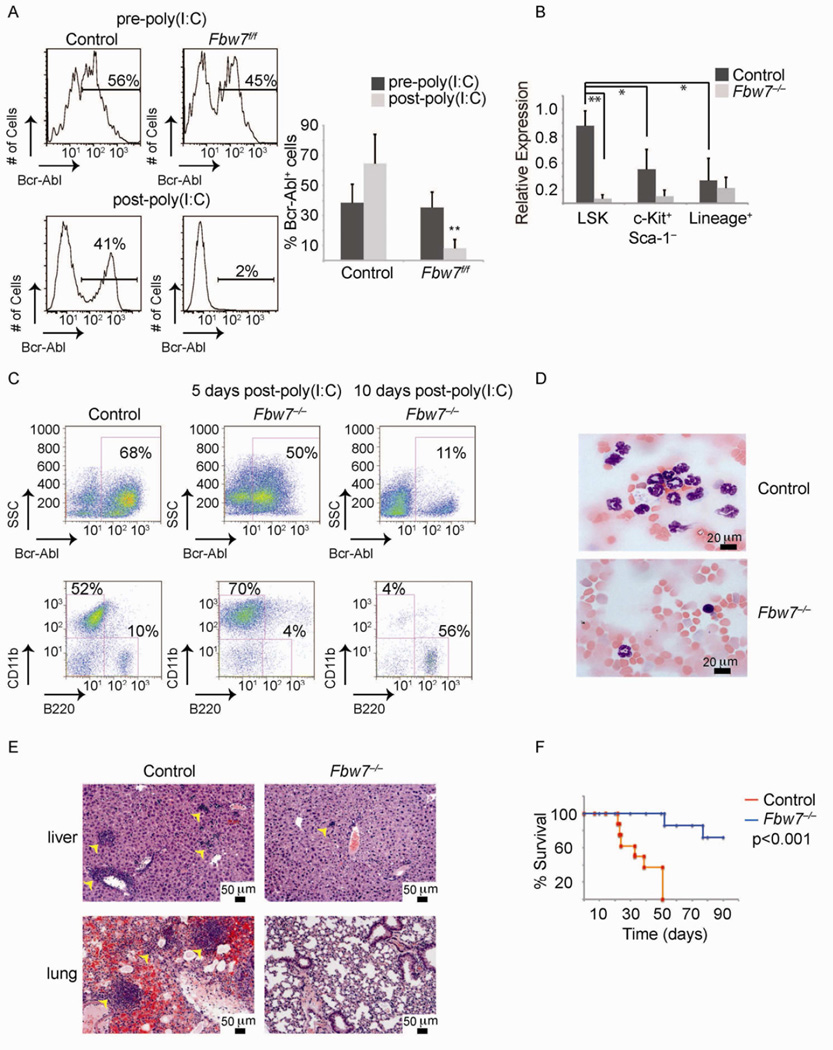
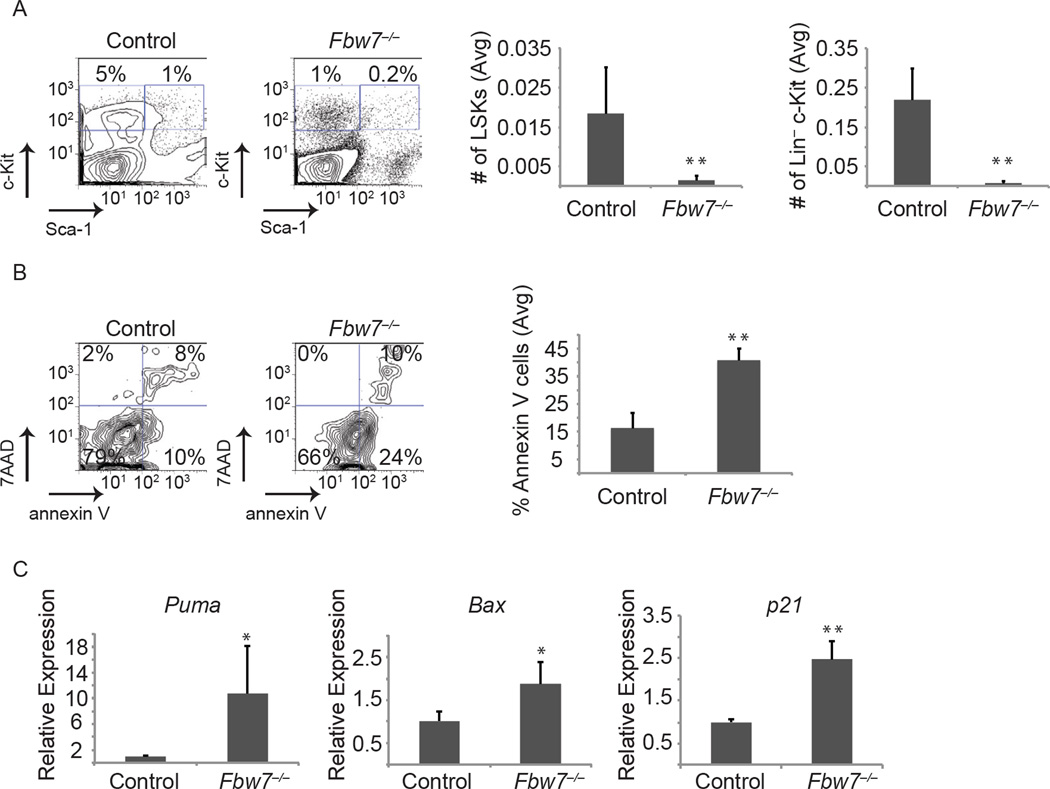
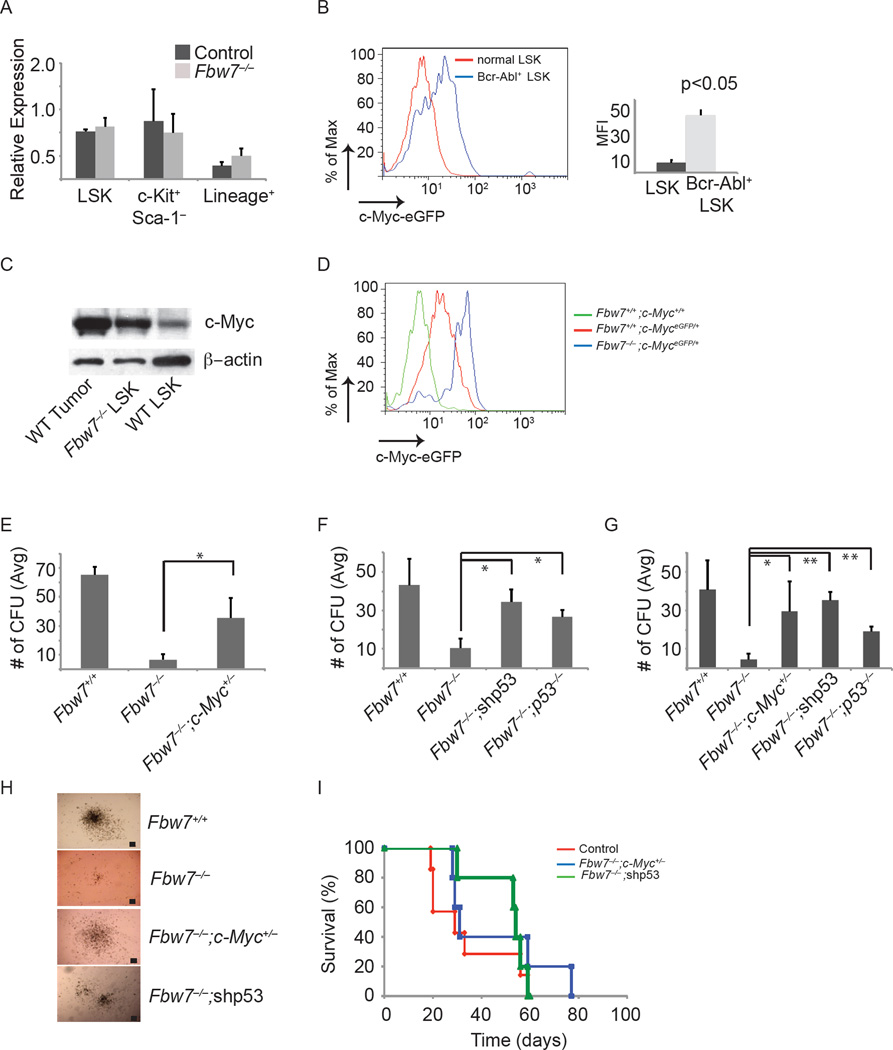
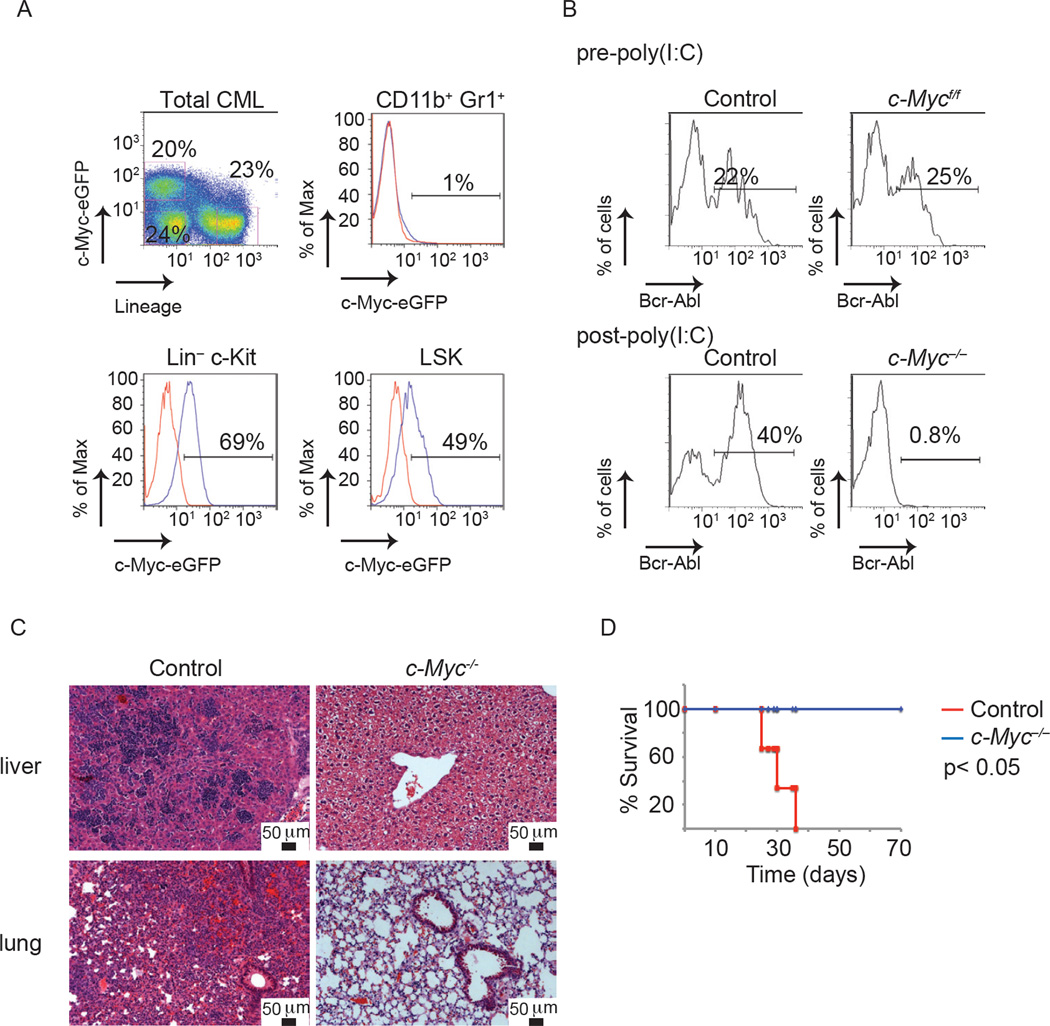
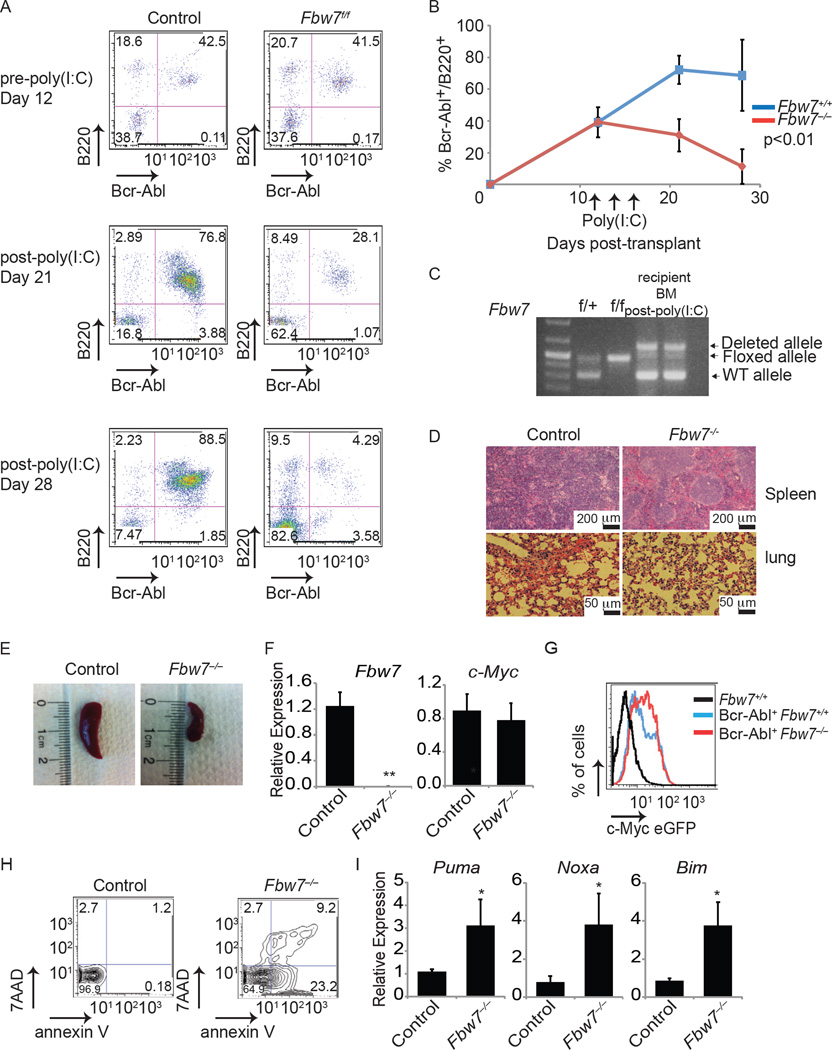
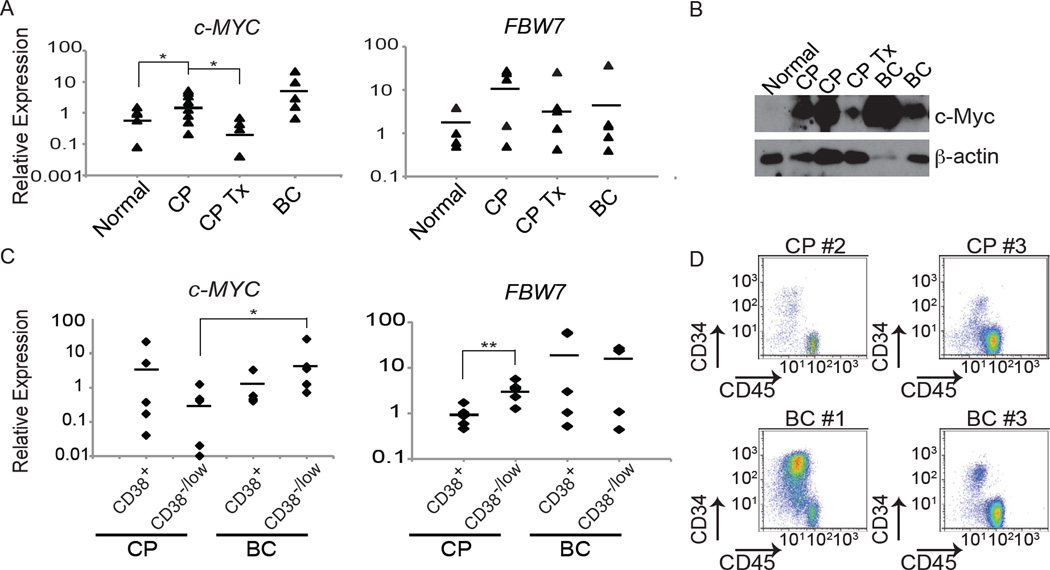
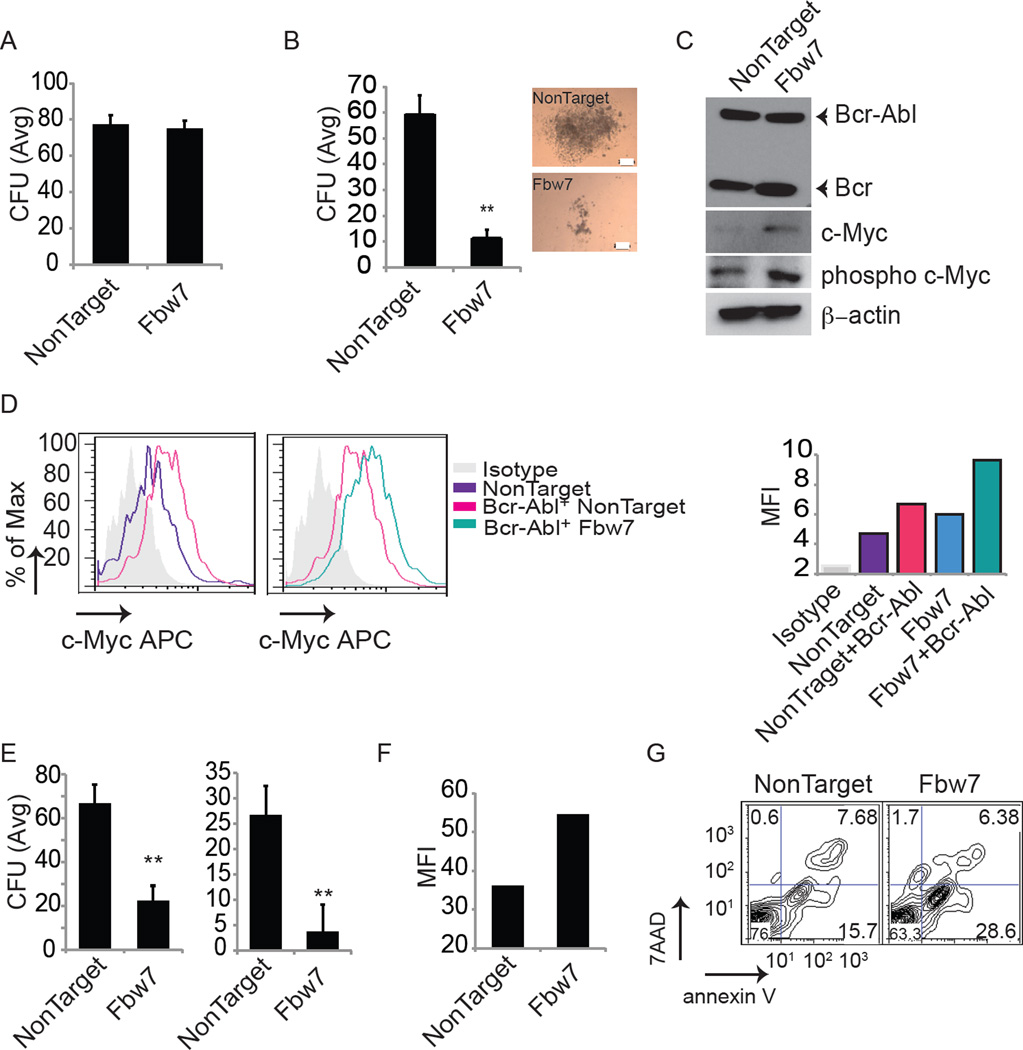
The molecular mechanisms regulating leukemia-initiating cell (LIC) function are of important clinical significance. We use chronic myelogenous leukemia (CML) as a model of LIC-dependent malignancy and identify the interaction between the ubiquitin ligase Fbw7 and its substrate c-Myc as a regulator of LIC homeostasis. Deletion of Fbw7 leads to c-Myc overexpression, p53-dependent LIC-specific apoptosis, and the eventual inhibition of tumor progression. A decrease of either c-Myc protein levels or attenuation of the p53 response rescues LIC activity and disease progression. Further experiments showed that Fbw7 expression is required for survival and maintenance of human CML LIC. These studies identify a ubiquitin ligase:substrate pair regulating LIC activity, suggesting that targeting of the Fbw7:c-Myc axis is an attractive therapy target in refractory CML.


Figures

Figure 1
Figure 1. Fbw7 deletion suppresses initiation of Bcr-Abl-induced CML
(A) Average CFU from VavCre+;Fbw7+/+ and VavCre+;Fbw7−/− cells infected with Bcr-Abl expressing retrovirus at the first plating. Image on right are representative colonies from control or Fbw7−/− Bcr-Abl+ LSKs. Scale bar 100 µm. (B–C) FACS analysis (B) and blood smears (C) of PB taken from host mice transplanted with VavCre+;Fbw7+/+ (Control) or VavCre+;Fbw7−/− Bcr-Abl+ LSK cells. D) Kaplan Meier survival curves of irradiated animals that were transplanted with VavCre+;Fbw7+/+ or VavCre+;Fbw7−/− Bcr-Abl+ LSKs. (n=5 for each genotype). Error bars indicate +/− SD. p<0.0001. See also Figure S1.
Figure 2
Figure 2. Fbw7 is essential for progression of established CML in vivo
(A) PB from mice transplanted with MxCre+;Fbw7+/+ and MxCre+;Fbw7−/− Bcr-Abl infected LSK cells. The bar graph on right is a quantification of Bcr-Abl+ cells in the PB. (B) qRT-PCR analysis of Fbw7 expression in sorted populations from WT and Fbw7−/− CML 5 days after the post-poly(I:C) injection. (C) FACS analysis of the BM of animals transplanted with Bcr-Abl+ LSK cells. (D) Blood smears ~10 days post poly(I:C) injections. (E) Hematoxylin and eosin (H&E) staining of liver and lung. (F) Kaplan Meier survival curves of irradiated animals that were transplanted with Fbw7+/+ or Fbw7−/− Bcr-Abl+ LSKs. (n=9 for each genotype). Error bars indicate +/−SD. * p<0.01, ** p<0.001. See also Figure S2
Figure 3
Figure 3. Fbw7 deletion affects CML-initiating cell survival through the activation of the p53 pathway
(A) FACS plots depicting the relative percentage of Bcr-Abl expressing stem and progenitor (LSK), and progenitors (Linc-Kit+Sca) cells in the BM of MxCre+;Fbw7+/+ or MxCre+;Fbw7−/−mice. Bar graphs depict number of tumor stem and progenitor cells based on frequency of LSK in total number of BM cells. (B) FACS plots showing relative annexin V and 7-AAD positive cells in the Bcr-Abl+ LSK subset in the BM. Graph on right represents percent of annexin V+ cells in the Bcr-Abl+ LSK. (C) qRT-PCR analysis showing expression of the p53 target genes, Puma, Bax, and p21, in sorted control or Fbw7−/− LSKs from the tumor. Error bars indicate +/−SD. (n=4 for each genotype). * p<0.05, ** p<0.01.
Figure 4
Figure 4. Decrease of c-Myc protein levels and inhibition of p53 activation are able to rescue CML-initiating activity
(A) qRT-PCR analysis of c-Myc expression in sorted tumor subsets (LSK, c-Kit+ and Lin+) (B) c-Myc protein expression in normal and Bcr-Abl+ LSK cells in the BM. Graph on right shows mean fluorescence intensity (MFI) for eGFP (c-Myc protein). (C) Western blot analysis of c-Myc protein expression in LSKs sorted from WT tumor, Fbw7−/− and WT mice. (D) c-Myc protein expression in MxCre+;Fbw7+/+ or MxCre+;Fbw7−/− Bcr-Abl+LSK. E) Average CFU from sorted Bcr-Abl+ LSK cells from MxCre+;Fbw7+/+, MxCre+;Fbw7−/−, or MxCre+;Fbw7−/−;Myc+/− mice. (F, G) Average CFU from sorted Bcr-Abl+ LSK cells from MxCre+;Fbw7+/+, MxCre+;Fbw7−/−, MxCre+;Fbw7−/−;shp53, or MxCre+;Fbw7−/−;p53−/− mice on the first (F) and secondary (G) platings. (H) Images of Bcr-Abl+ colonies generated from the indicated genotypes (n=3 for each genotype). Scale bar 100 µm. (I) Kaplan Meier survival curves of animals transplanted with control (red), Fbw7−/−;Myc+/− (blue) LSKs transduced with a retrovirus expressing Bcr-Abl, or Fbw7−/− LSKs transduced with a retrovirus expressing Bcr-Abl and a shRNA targeting p53 (green). Error bars indicate +/−SD. *p<0.01, **p<0.001. See also Figure S3.
Figure 5
Figure 5. CML-initiating cell activity and disease progression depends on c-Myc expression and activity
(A) c-Myc protein expression in Bcr-Abl+ CML tumor subsets. (B–D) Mice transplanted with LSKs expressing Bcr-Abl from MxCre+;c-Myc+/+ and MxCre+;c-Mycf/f mice and treated with poly(I:C) following disease initiation. (B) PB analysis of mice, (C) H&E staining of liver and lung, and (D) Kaplan Meier survival curves of animals transplanted with MxCre+;Myc+/+ (red), MxCre+;Myc−/− (blue) (n=5 for each genotype). See also Figure S4.
Figure 6
Figure 6. Depletion of Fbw7 inhibits progression of B-ALL
(A) FACS analysis of PB from mice transplanted with MxCre+;Fbw7+/+ and MxCre+;Fbw7−/− total BM cells expressing Bcr-Abl. Upper panel: 12 days post-transplant but prior to poly(I:C) treatment. Middle and lower panels: Day 21 and 28 days post-poly(I:C) treatment, respectively. (B) Graph depicting the percent of Bcr-Abl+ B220+ cells in the PB of both cohorts. (C) Genotyping PCR from recipient BM. (D) H&E staining of spleen and lung. (E) Representative spleen at day 28. (F) qRT-PCR analysis of Fbw7 and c-Myc expression in sorted tumor. (G) c-Myc protein expression in spleen of recipient animals gated on Bcr-Abl+ B220+. (H) FACS plots showing annexin V+ and 7-AAD+ cells in the Bcr-Abl+ B220+ cells in the BM. (I) qRT-PCR analysis showing the expression of p53 target genes, Puma, Bim, and Noxa, in sorted control or Fbw7−/− tumors. Error bars indicate +/−SD. *p<0.01, **p<0.001
Figure 7
Figure 7. FBW7 and c-MYC expression patterns in human CML
(A and B) FBW7 and c-MYC mRNA levels (A, determined by qRT-PCR, bar indicates average) and c-Myc protein levels (B, determined by Western blot) from total PBMNCs in healthy individuals (normal), CML patients in CP without treatment (CP) or being treated with Imatinib (CP Tx), or in BC (BC). (C) qRT-PCR for c-MYC and FBW7 mRNA levels from CD34+CD38+ and CD34+CD38low populations from BM of patients in CP, and BC normalized to normal UCB derived CD34+CD38low. Bar indicates average. (D) FACS plots showing CD45 and CD34 expression in human CML patients used to sort CD34+CD38+ and CD34+CD38low cell populations. *p<0.01, **p<0.001
Figure 8
Figure 8. Fbw7 silencing in human CML-initiating cells leads to induction of apoptosis and loss of differentiation potential
(A) Average CFU from normal UCB derived CD34+ cells expressing shRNA against either NonTarget or Fbw7. (B–D) Normal UCB derived CD34+ expressing Bcr-Abl together with shRNAs against either NonTarget or Fbw7. Progeny of cells were plated in CFU assay (B, Scale bar 200µm) and western blot for c-Myc, Phospho-c-Myc, and Bcr-Abl in total progeny of CD34+ cells (C). (D) c-Myc expression determined by intracellular FACS gated on CD34+ population. Graph on right shows MFI for c-Myc protein. (E–G) CP patient BM derived CD34+ cells were transduced with lentivirus expressing either control or shRNAs against Fbw7, puromycin selected for 48 hours. (E) Average CFU assay from CD34+ progeny in two different patients. (F) MFI for c-Myc protein for representative CML patient derived CD34+ cells following Fbw7 silencing. (G) Representative annexin V staining of patient derived CD34+ cells following lentiviral transduction. Error bars indicate +/− SD. *p<0.01, **p<0.001. See also Figure S5.

References

    1. Aghajan M, Jonai N, Flick K, Fu F, Luo M, Cai X, Ouni I, Pierce N, Tang X, Lomenick B, et al. Chemical genetics screen for enhancers of rapamycin identifies a specific inhibitor of an SCF family E3 ubiquitin ligase. Nat Biotechnol. 2010;28:738–742. - PMC - PubMed
    1. Bartram CR, de Klein A, Hagemeijer A, van Agthoven T, Geurts van Kessel A, Bootsma D, Grosveld G, Ferguson-Smith MA, Davies T, Stone M, et al. Translocation of c-ab1 oncogene correlates with the presence of a Philadelphia chromosome in chronic myelocytic leukaemia. Nature. 1983;306:277–280. - PubMed
    1. Bhatia R, Holtz M, Niu N, Gray R, Snyder DS, Sawyers CL, Arber DA, Slovak ML, Forman SJ. Persistence of malignant hematopoietic progenitors in chronic myelogenous leukemia patients in complete cytogenetic remission following imatinib mesylate treatment. Blood. 2003;101:4701–4707. - PubMed
    1. Bonnet D, Dick JE. Human acute myeloid leukemia is organized as a hierarchy that originates from a primitive hematopoietic cell. Nat Med. 1997;3:730–737. - PubMed
    1. Bric A, Miething C, Bialucha CU, Scuoppo C, Zender L, Krasnitz A, Xuan Z, Zuber J, Wigler M, Hicks J, et al. Functional identification of tumor-suppressor genes through an in vivo RNA interference screen in a mouse lymphoma model. Cancer Cell. 2009;16:324–335. - PMC - PubMed

Publication types

MeSH terms