Hospital variation and temporal trends in palliative and end-of-life care in the ICU
- PMID: 23518869
- PMCID: PMC4009379
- DOI: 10.1097/CCM.0b013e318287f289
Hospital variation and temporal trends in palliative and end-of-life care in the ICU
Abstract
Objectives: Although studies have shown regional and interhospital variability in the intensity of end-of-life care, few data are available assessing variability in specific aspects of palliative care in the ICU across hospitals or interhospital variability in family and nurse ratings of this care. Recently, relatively high family satisfaction with ICU end-of-life care has prompted speculation that ICU palliative care has improved over time, but temporal trends have not been documented.
Design/setting: Retrospective cohort study of consecutive patients dying in the ICU in 13 Seattle-Tacoma-area hospitals between 2003 and 2008.
Measurements: We examined variability over time and among hospitals in satisfaction and quality of dying assessed by family, quality of dying assessed by nurses, and chart-based indicators of palliative care. We used regression analyses adjusting for patient, family, and nurse characteristics.
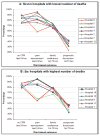
Main results: Medical charts were abstracted for 3,065 of 3,246 eligible patients over a 55-month period. There were significant differences between hospitals for all chart-based indicators (p < 0.001), family satisfaction (p < 0.001), family-rated quality of dying (p = 0.03), and nurse-rated quality of dying (p = 0.003). There were few significant changes in these measures over time, although we found a significant increase in pain assessments in the last 24 hours of life (p < 0.001) as well as decreased documentation of family conferences (p < 0.001) and discussion of prognosis (p = 0.020) in the first 72 hours in the ICU.
Conclusions: We found significant interhospital variation in ratings and delivery of palliative care, consistent with prior studies showing variation in intensity of care at the end of life. We did not find evidence of temporal changes in most aspects of palliative care, family satisfaction, or nurse/family ratings of the quality of dying. With the possible exception of pain assessment, there is little evidence that the quality of palliative care has improved over the time period studied.
Trial registration: ClinicalTrials.gov NCT00685893.
Conflict of interest statement
The authors have not disclosed any potential conflicts of interest.
Figures


Comment in
-
Palliative care in the ICU: lots of questions, few answers*.Crit Care Med. 2013 Jun;41(6):1568-9. doi: 10.1097/CCM.0b013e31828c25d8. Crit Care Med. 2013. PMID: 23685576 No abstract available.
References
-
- Angus DC, Barnato AE, Linde-Zwirble WT, et al. Robert Wood Johnson Foundation ICU End-Of-Life Peer Group: Use of intensive care at the end of life in the United States: An epidemiologic study. Crit Care Med. 2004;32:638–643. - PubMed
-
- The SUPPORT Principal Investigators: A controlled trial to improve care for seriously ill hospitalized patients: The study to understand prognoses and preferences for outcomes and risks of treatments (SUPPORT) JAMA. 1995;274:1591–1598. - PubMed
Publication types
MeSH terms
Associated data
Grants and funding
LinkOut - more resources
Full Text Sources
Other Literature Sources
Medical

