Clinical Trial
. 2013 Apr;3(4):418-29.
doi: 10.1158/2159-8290.CD-12-0383. Epub 2013 Mar 21.

Multifunctional T-cell analyses to study response and progression in adoptive cell transfer immunotherapy

Affiliations
Clinical Trial

Multifunctional T-cell analyses to study response and progression in adoptive cell transfer immunotherapy

Chao Ma et al. Cancer Discov. 2013 Apr.

Abstract

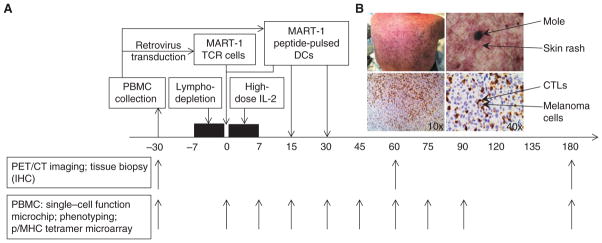
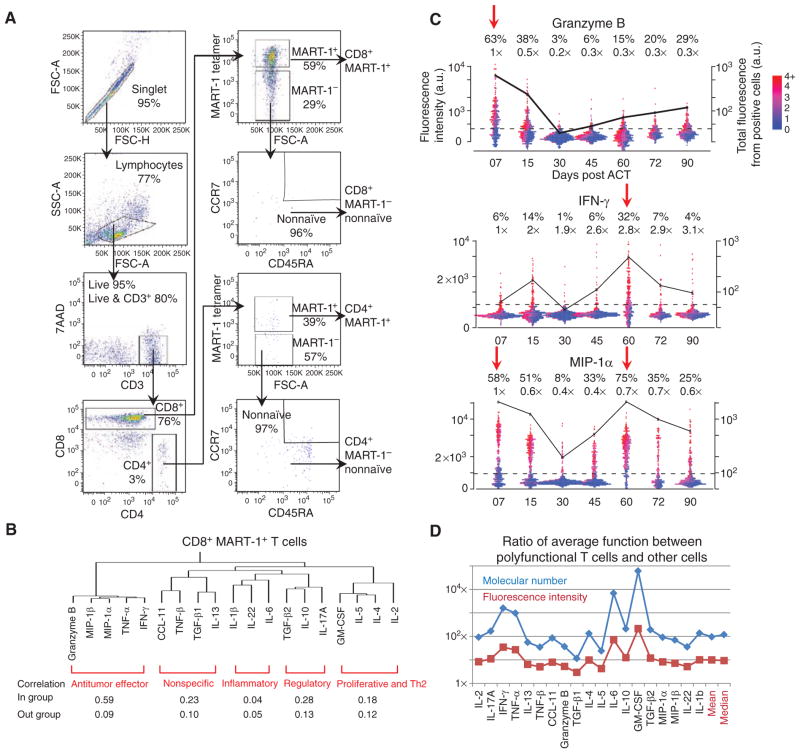
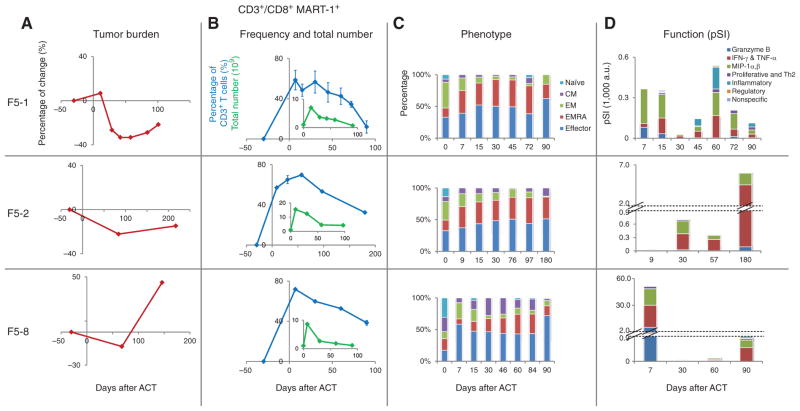
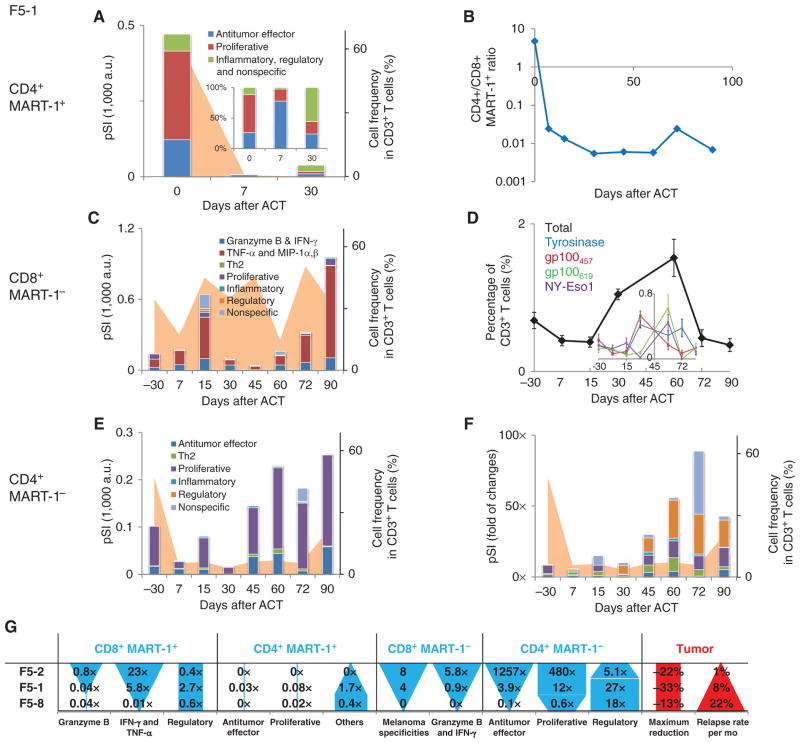
Adoptive cell transfer (ACT) of genetically engineered T cells expressing cancer-specific T-cell receptors (TCR) is a promising cancer treatment. Here, we investigate the in vivo functional activity and dynamics of the transferred cells by analyzing samples from 3 representative patients with melanoma enrolled in a clinical trial of ACT with TCR transgenic T cells targeted against the melanosomal antigen MART-1. The analyses included evaluating 19 secreted proteins from individual cells from phenotypically defined T-cell subpopulations, as well as the enumeration of T cells with TCR antigen specificity for 36 melanoma antigens. These analyses revealed the coordinated functional dynamics of the adoptively transferred, as well as endogenous, T cells, and the importance of highly functional T cells in dominating the antitumor immune response. This study highlights the need to develop approaches to maintaining antitumor T-cell functionality with the aim of increasing the long-term efficacy of TCR-engineered ACT immunotherapy.

Significance: A longitudinal functional study of adoptively transferred TCR–engineered lymphocytes yielded revealing snapshots for understanding the changes of antitumor responses over time in ACT immunotherapy of patients with advanced melanoma.

Trial registration: ClinicalTrials.gov NCT00910650.


Conflict of interest statement

Disclosure of Potential Conflicts of Interest

No potential conflicts of interest were disclosed.

Figures

Figure 1
Figure 1
MART-1TCR transgenic T-cell ACT therapy. A, the boxes above the timeline show different modules of the therapy, with arrows pointing to the time they are administered relative to day 0 (the day of the infusion of the TCR-engineered T cells). Arrows below the timeline show the dates when blood samples are collected for different assays. B, photo of one representative patient’s back with skin rash surrounding moles (top). In the immunohistochemical (IHC) staining of a tumor biopsy (bottom), CD8+ CTLs are stained as dark brown and melanoma cells are blue. PET/CT, positron emission tomography/computed tomography.
Figure 2
Figure 2
FACS scheme for purifying phenotypically defined T cells and general properties of T-cell functions. A, multiparametric FACS purification for selecting phenotypically defined T-cell populations. A representative set of scatterplots is shown with the surface markers used and the cell frequency for each gating. B, hierarchical clustering of the 19 functional cytokines studied on the basis of the single-cell cytokine secretion measurement of CD8+ MART-1+ T cells from all 3 patients, and across all time points. Each functional group is identified and labeled (red). Protein–protein correlations for proteins within the same group and across groups are given below the clustering map. C, one-dimensional scatterplots of 3 representative cytokines produced by single cells, separated by time points. The dotted line represents the gate that separates cytokine-producing and nonproducing cells. The percentages given above the plots denote the frequency of positive cells and the relative mean fluorescence intensity (MFI) of those cells relative to day 7. Each point represents a single-cell assay. The points are color encoded (from purple to red) to represent the number of different proteins produced by each cell. The black trend line shows the total functional intensity of the positive cells for the specific cytokine plotted, computed as the frequency of positive cells, multiplied by their MFI. D, ratio between the MFI (red line) and the molecular number of cytokines (blue line) for polyfunctional T cells (cells with 5 or more functions) and all other cells, for each cytokine. At far right are the mean and median values, averaged over all cytokines. 7-AAD, 7-aminoactinomycin D; CCL, CC chemokine ligand; FSC, forward scatter; GM-CSF, granulocyte macrophage colony-stimulating factor; MIP, macrophage-inflammatory protein; SSC, side scatter.
Figure 3
Figure 3
Time-dependent changes in tumor burden, and in number, phenotype, and function of CD8+ MART-1+ T cells. Each row provides results for a different patient (F5-1, F5-2, and F5-8). A, changes in tumor burden, as measured by a modified RECIST method (see Methods). B, changes of frequency (blue) and total number (green insert) of CD8+ MART-1+ T cells. C, phenotypic changes of CD8+ MART-1+ T cells. The percentage of each T-cell phenotype (naïve, central memory, effector memory, effector memory RA, effector) is represented by a different color. D, functional changes (in pSI) of CD8+ MART-1+ T cells. Each cytokine function group is represented by a different color. For F5-2 and F5-8, the y-axis is discontinuous to allow for representation of large functional differences on the same graph.
Figure 4
Figure 4
Functional changes of other T-cell types for patient F5-1 over time and a summary of functional changes for all 3 patients. A, functional changes of the CD4+ MART-1+ T cells, plotted as a bar graph in pSI. The total frequency of this phenotype is plotted as the orange background. Each cytokine function group is represented by a different color. The percent composition of the functions is provided in the inset. B, the frequency ratio of CD4+ MART-1+ to CD8+ MART-1+ T cells. C, functional changes of the CD8+ MART-1 T cells, with cell frequency presented as the orange background. D, frequency of antigen-specific T cells recognizing melanoma antigen other than MART-1 over the course of the therapy. The total frequency is plotted as the black line to provide an overall view of epitope spreading. The frequency of each antigen specificity detected is provided in the inset, denoted by different colors. E, functional changes of the CD4+ MART-1 T cells, with cell frequency presented as the orange background. F, relative functional changes of the CD4+ MART-1 T cells normalized to those observed at day 7 by each cytokine group, along with cell frequency. G, a summary of functional changes for each T-cell type analyzed across 3 patients. The ratio is calculated by the pSI for a cytokine functional group at day 60 relative to that at day 7. The patients are ordered according to increasing tumor relapse rate. The differences between patients in cell function (solid blue shapes) and in tumor burden (red shapes) are shown graphically in the table.

Comment in

References

    1. Ribas A, Camacho LH, Lopez-Berestein G, Pavlov D, Bulanhagui CA, Millham R, et al. Antitumor activity in melanoma and anti-self responses in a phase I trial with the anti-cytotoxic T lymphocyte–associated antigen 4 monoclonal antibody CP-675,206. J Clin Oncol. 2005;23:8968–77. - PubMed
    1. Porter DL, Levine BL, Kalos M, Bagg A, June CH. Chimeric antigen receptor-modified T cells in chornic lymphoid leukemia. N Engl J Med. 2011;365:725–33. - PMC - PubMed
    1. Rosenberg SA, Restifo NP, Yang JC, Morgan RA, Dudley ME. Adoptive cell transfer: a clinical path to effective cancer immunotherapy. Nat Rev Cancer. 2008;8:299–308. - PMC - PubMed
    1. Restifo NP, Dudley ME, Rosenberg SA. Adoptive immunotherapy for cancer: harnessing the T cell response. Nat Rev Immunol. 2012;12:269–81. - PMC - PubMed
    1. Hunder NN, Wallen H, Cao J, Hendricks DW, Reilly JZ, Rodmyre R, et al. Treatment of metastatic melanoma with autologous CD4+ T cells against NY-ESO-1. N Engl J Med. 2008;358:2698–703. - PMC - PubMed

Publication types

Associated data