. 2013 Jul;20(7):878-87.
doi: 10.1038/cdd.2013.21. Epub 2013 Mar 22.

Inhibition of hepatocyte autophagy increases tumor necrosis factor-dependent liver injury by promoting caspase-8 activation

Affiliations

Inhibition of hepatocyte autophagy increases tumor necrosis factor-dependent liver injury by promoting caspase-8 activation

M Amir et al. Cell Death Differ. 2013 Jul.

Abstract

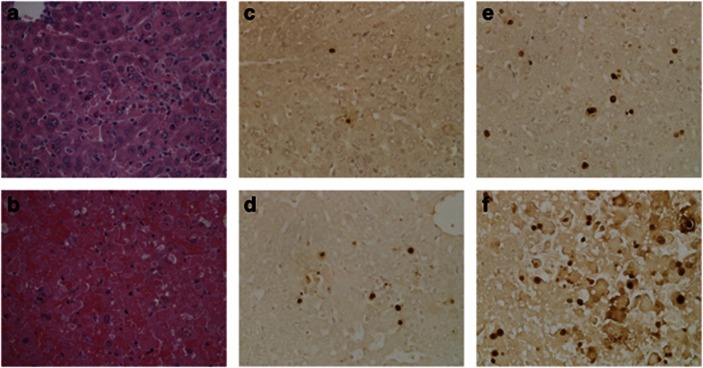
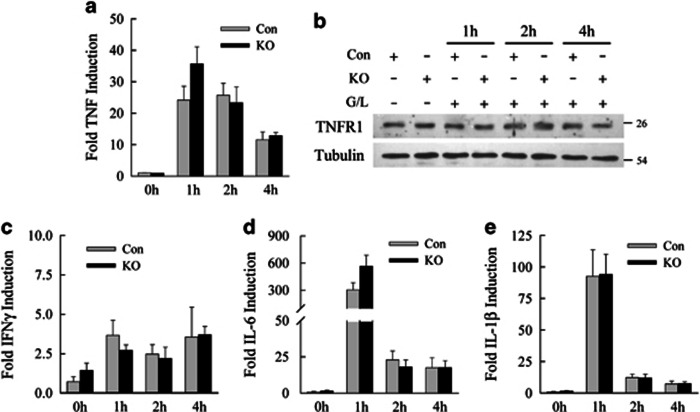
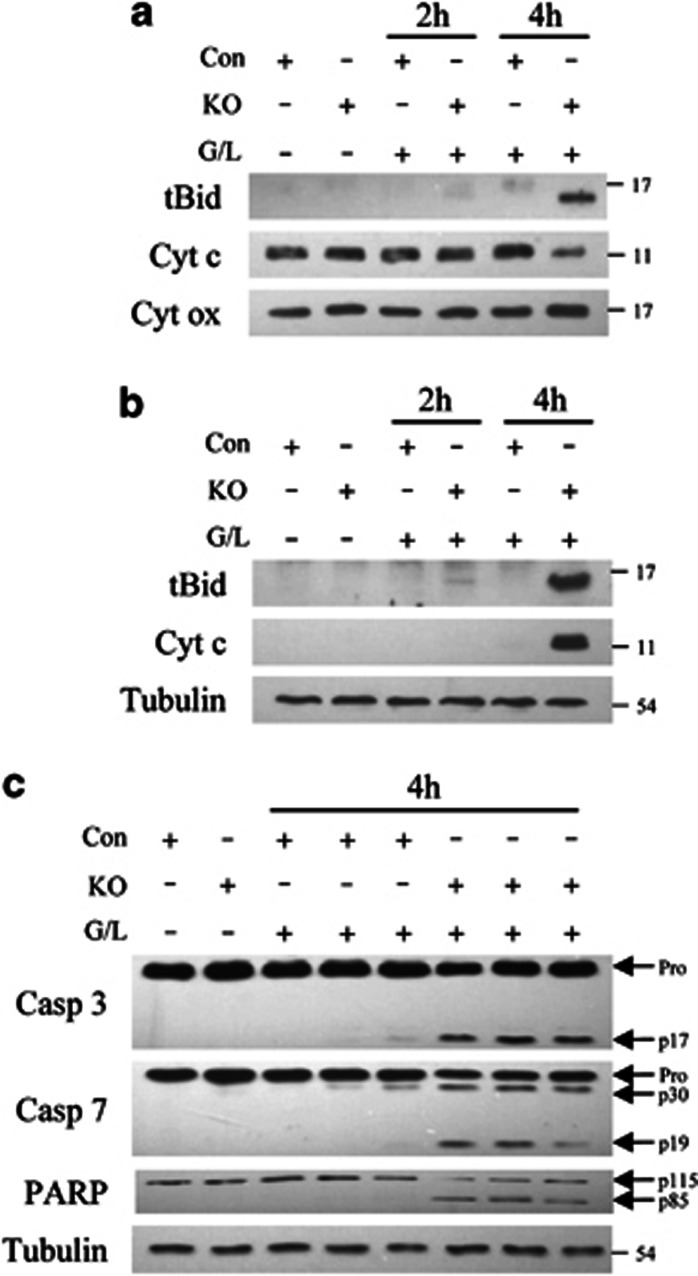
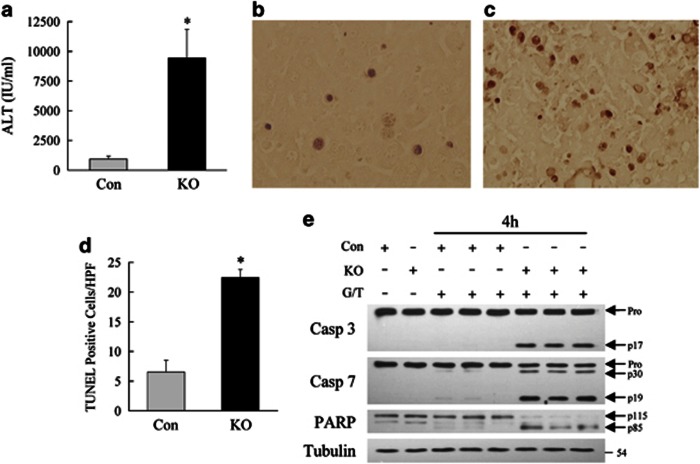
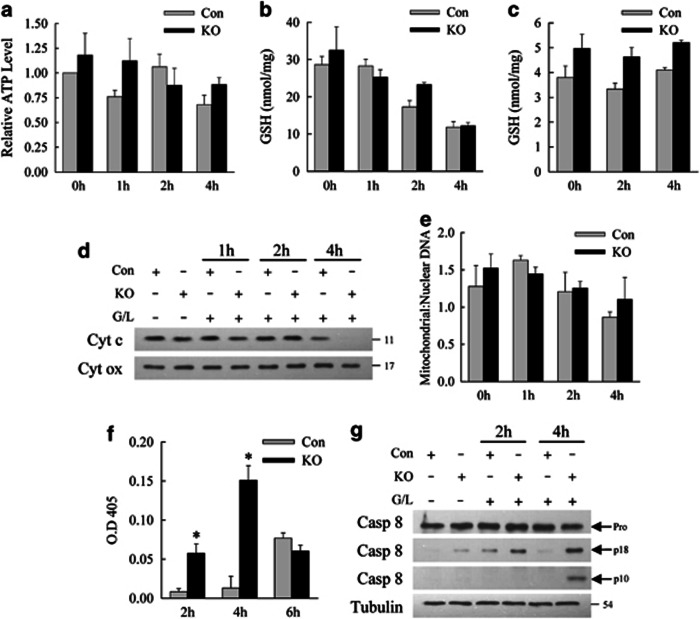
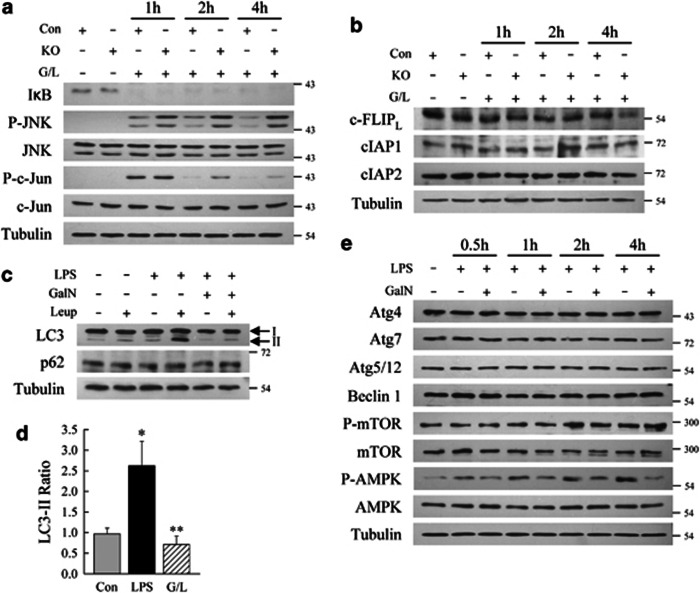
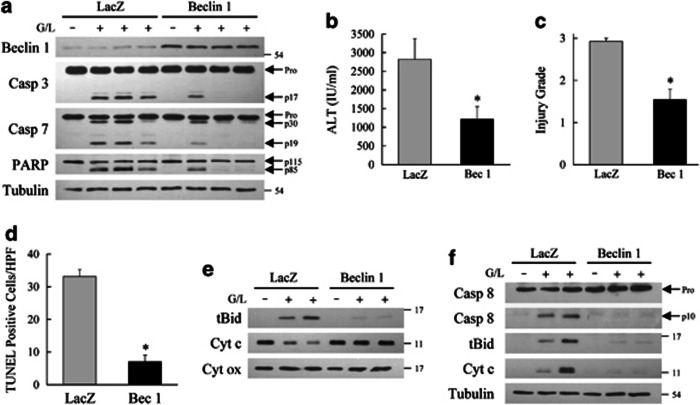
Recent investigations have demonstrated a complex interrelationship between autophagy and cell death. A common mechanism of cell death in liver injury is tumor necrosis factor (TNF) cytotoxicity. To better delineate the in vivo function of autophagy in cell death, we examined the role of autophagy in TNF-induced hepatic injury. Atg7Δhep mice with a hepatocyte-specific knockout of the autophagy gene atg7 were generated and cotreated with D-galactosamine (GalN) and lipopolysaccharide (LPS). GalN/LPS-treated Atg7Δhep mice had increased serum alanine aminotransferase levels, histological injury, numbers of TUNEL (terminal deoxynucleotide transferase-mediated deoxyuridine triphosphate nick end-labeling)-positive cells and mortality as compared with littermate controls. Loss of hepatocyte autophagy similarly sensitized to GalN/TNF liver injury. GalN/LPS injury in knockout animals did not result from altered production of TNF or other cytokines. Atg7Δhep mice had accelerated activation of the mitochondrial death pathway and caspase-3 and -7 cleavage. Increased cell death did not occur from direct mitochondrial toxicity or a lack of mitophagy, but rather from increased activation of initiator caspase-8 causing Bid cleavage. GalN blocked LPS induction of hepatic autophagy, and increased autophagy from beclin 1 overexpression prevented GalN/LPS injury. Autophagy, therefore, mediates cellular resistance to TNF toxicity in vivo by blocking activation of caspase-8 and the mitochondrial death pathway, suggesting that autophagy is a therapeutic target in TNF-dependent tissue injury.


Figures

Figure 1
Figure 1
Inhibition of hepatocyte autophagy increases GalN/LPS liver injury. (a) Serum ALT levels in littermate controls (Con) and Atg7Δhep (KO) mice untreated (0 h) and at 1 and 2 h after GalN/LPS administration (*P<0.001 as compared with control mice; n=9–10). (b) Histological grade of liver injury in untreated and GalN/LPS-treated mice (*P<0.03 as compared with control mice; n=5–7). (c) Serum ALT levels at 4 and 6 h (*P<0.0001 as compared with control mice; n=5–10). (d) Numbers of TUNEL-positive cells per high power field (HPF; *P<0.05; **P<0.006; n=3–8). (e) Histological grade of hepatic inflammation (*P<0.02 as compared with control mice; n=5–7). (f) Survival curve after GalN/LPS treatment (P<0.001; n=14–31)
Figure 2
Figure 2
Knockout livers have increased histological liver injury and TUNEL staining. Hematoxylin and eosin stained liver sections from control (a) and knockout (b) mice 4 h after GalN/LPS administration. TUNEL staining in control (c, e) and knockout (d, f) livers at 2 h (c, d) and 4 h (e, f) after GalN/LPS. Magnifications for all, × 400
Figure 3
Figure 3
Cytokine induction by GalN/LPS is equivalent in control (Con) and knockout (KO) mice. (a) Relative TNF mRNA levels determined by real-time PCR in Con and KO mice at the indicated hours after GalN/LPS administration (n=5-6). (b) Immunoblots of total liver protein from Con and KO mice untreated or treated with GalN/LPS (G/L) for the indicated times, and probed for TNF-receptor type 1 (TNFR1) and tubulin as a loading control. Relative mRNA levels in the same mice for IFNγ (c), IL-6 (d) and IL-1β (e) (n=5–6)
Figure 4
Figure 4
Knockout (KO) mice have increased activation of the mitochondrial death pathway. (a) Immunoblots of mitochondrial protein isolates from control (Con) and KO mice untreated or treated with GalN/LPS (G/L) for 2 or 4 h. The proteins were probed for truncated Bid (tBid), cytochrome c (Cyt c) and cytochrome oxidase (Cyt ox) as a loading control. (b) Cytosolic fractions from the same mouse livers immunoblotted for tBid, Cyt c and tubulin as a loading control. (c) Immunoblots of total hepatic protein from untreated and 4 h GalN/LPS-treated mice for caspase-3 (Casp 3), caspase-7 (Casp 7), PARP and tubulin. Arrows indicate the procaspases (Pro), the cleaved caspase-3 (p17) and -7 (p30 and p19) forms, and the intact (p115) and cleaved (p85) forms of PARP. Results are representative of three independent experiments
Figure 5
Figure 5
Liver injury from GalN/TNF is increased in knockout (KO) mice. (a) Serum ALT levels in littermate control (Con) and KO mice 4 h after GalN/TNF treatment (*P<0.001 as compared with control mice; n=6-7). (b) TUNEL staining of control mouse liver 4 h after GalN/TNF. (c) TUNEL staining of 4 h GalN/LPS-treated KO liver. (d) Numbers of TUNEL-positive cells per high power field (HPF; *P<0.001 as compared with control mice; n=3-4). (e) Immunoblots of total hepatic protein from untreated and 4 h GalN/TNF-treated Con and KO mice for caspase-3 (Casp 3), caspase-7 (Casp 7), PARP and tubulin. Arrows indicate the procaspases (Pro), the cleaved caspase-3 (p17) and -7 (p30 and p19) forms, and the intact (p115) and cleaved (p85) forms of PARP
Figure 6
Figure 6
Mitochondrial death pathway activation in the absence of autophagy results from increased caspase-8 activation. (a) Relative ATP levels in the livers of control (Con) and knockout (KO) mice at the indicated hours after GalN/LPS treatment (n=3-4). (b) Total hepatic GSH levels in Con and KO mice after GalN/LPS treatment (n=3). (c) Mitochondrial GSH levels in identically treated mice (n=2-3). (d) Total liver protein homogenates from untreated and GalN/LPS-treated mice immunoblotted for cytochrome c (Cyt c) and cytochrome oxidase (Cyt ox). (e) Ratio of mitochondrial to nuclear DNA in the livers of the same animals (n=3-5). (f) Relative caspase-8 activity as measured by optical density (O.D.) at 405 nm in the two types of mice treated with GalN/LPS for the indicated times (*P<0.003; n=4-5). (g) Immunoblots of hepatic cellular protein isolates from untreated and GalN/LPS-treated mice probed for caspase-8. The three images are different exposures of the same immunoblot. The procaspase (Pro) and cleaved (p18 and p10) forms of caspase-8 are indicated by arrows. Immunoblots are representative of findings from 3 independent experiments
Figure 7
Figure 7
Knockout (KO) mice have increased JNK activation and GalN blocks the induction of autophagy by LPS. (a) Total liver protein from control (Con) and KO mice untreated or treated with GalN/LPS (G/L) for the hours shown and immunoblotted for the total or phosphorylated (P-) forms of the indicated proteins. (b) Immunoblots of the same hepatic protein samples probed for the proteins shown. (c) Immunoblots of total liver protein from wild-type mice untreated or treated with LPS alone or GalN/LPS for 4 h. Some mice were also injected with leupeptin (Leup) 2 h before killing. Proteins were probed for LC3, p62 and tubulin, and the LC3-I and -II forms are labeled with arrows. (d) Quantification of the ratio of LC3-II in leupeptin-injected to uninjected Con, LPS-treated (LPS) and GalN/LPS-treated (G/L) mouse livers by densitometric scanning of immunoblots (*P<0.004 as compared with control; **P<0.02 as compared with LPS-injected; n=4). (e) Immunoblots of total hepatic protein from wild-type mice untreated or treated with LPS or GalN/LPS and probed for the indicated total or phosphorylated (P-) proteins. Results are representative of three independent experiments
Figure 8
Figure 8
Beclin-1-induced increase in autophagy prevents liver injury from GalN/LPS. (a) Mice were infected with the control LacZ or beclin-1-expresssing rAAV and left untreated or treated with GalN/LPS (G/L) for 5 h. Total liver protein was immunoblotted for beclin 1, caspase-3 (Casp 3), caspase-7 (Casp 7), PARP and tubulin. Arrows indicate the procaspases (Pro), the cleaved caspase-3 (p17) and -7 (p30 and p19) forms, and intact (p115) and cleaved (p85) PARP. (b) Serum ALT levels at 5 h after GalN/LPS treatment (*P<0.02 as compared with control mice; n=7–11). (c) Histological grade of liver injury in the same mice (*P<0.0005 as compared with control mice; n=7–11). (d) Numbers of TUNEL-positive cells per high power field (HPF; *P<0.001; n=3). (e) Mitochondrial protein isolates from rAAV-infected mice untreated or treated with GalN/LPS (G/L) for 5 h and probed for truncated Bid (tBid), cytochrome c (Cyt c) and cytochrome oxidase (Cyt ox) as a loading control. (f) Immunoblots of cytosolic protein from the same mice immunoblotted for caspase-8 and the other indicated proteins. The procaspase and cleaved caspase-8 images are different exposures of the same immunoblot. Results are representative of two independent experiments

Comment in

References

    1. Kroemer G, Levine B. Autophagic cell death: the story of a misnomer. Nat Rev Mol Cell Biol. 2008;9:1004–1010. - PMC - PubMed
    1. Paglin S, Hollister T, Delohery T, Hackett N, McMahill M, Sphicas E, et al. A novel response of cancer cells to radiation involves autophagy and formation of acidic vesicles. Cancer Res. 2001;61:439–444. - PubMed
    1. Espert L, Denizot M, Grimaldi M, Robert-Hebmann V, Gay B, Varbanov M, et al. Autophagy is involved in T cell death after binding of HIV-1 envelope proteins to CXCR4. J Clin Invest. 2006;116:2161–2172. - PMC - PubMed
    1. Boya P, Gonzalez-Polo RA, Casares N, Perfettini JL, Dessen P, Larochette N, et al. Inhibition of macroautophagy triggers apoptosis. Mol Cell Biol. 2005;25:1025–1040. - PMC - PubMed
    1. Hamacher-Brady A, Brady NR, Gottlieb RA. Enhancing macroautophagy protects against ischemia/reperfusion injury in cardiac myocytes. J Biol Chem. 2006;281:29776–29787. - PubMed

Publication types

MeSH terms