. 2013 Mar 15;2(3):351-61.
doi: 10.1242/bio.20133830. Epub 2013 Jan 30.

The constant beat: cardiomyocytes adapt their forces by equal contraction upon environmental stiffening

Affiliations

The constant beat: cardiomyocytes adapt their forces by equal contraction upon environmental stiffening

Nils Hersch et al. Biol Open. .

Abstract

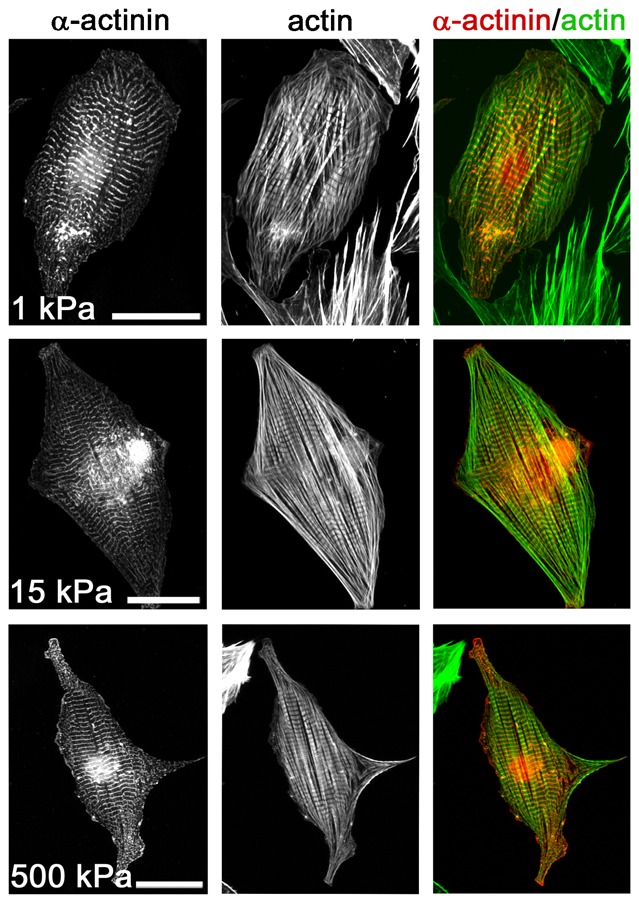
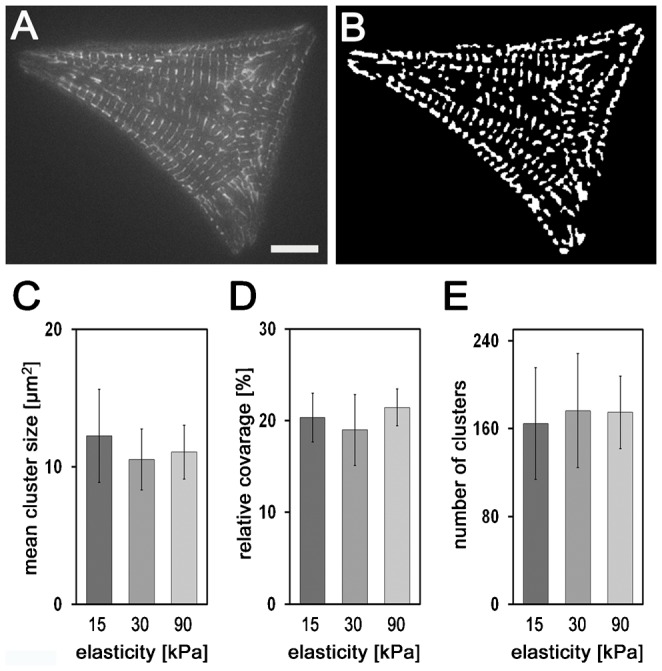
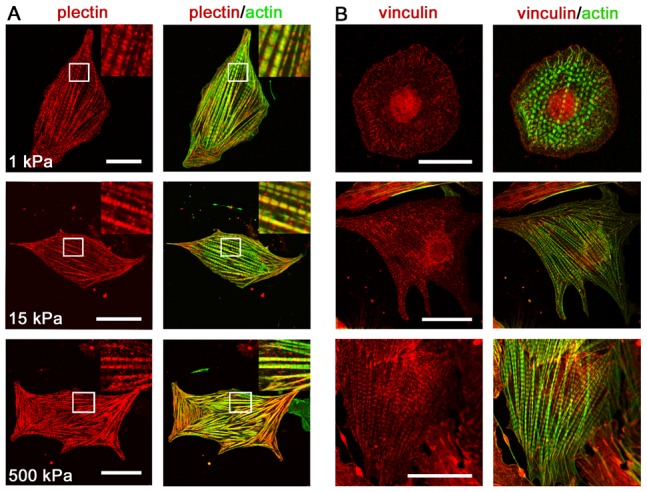
Cardiomyocytes are responsible for the permanent blood flow by coordinated heart contractions. This vital function is accomplished over a long period of time with almost the same performance, although heart properties, as its elasticity, change drastically upon aging or as a result of diseases like myocardial infarction. In this paper we have analyzed late rat embryonic heart muscle cells' morphology, sarcomere/costamere formation and force generation patterns on substrates of various elasticities ranging from ∼1 to 500 kPa, which covers physiological and pathological heart stiffnesses. Furthermore, adhesion behaviour, as well as single myofibril/sarcomere contraction patterns, was characterized with high spatial resolution in the range of physiological stiffnesses (15 kPa to 90 kPa). Here, sarcomere units generate an almost stable contraction of ∼4%. On stiffened substrates the contraction amplitude remains stable, which in turn leads to increased force levels allowing cells to adapt almost instantaneously to changing environmental stiffness. Furthermore, our data strongly indicate specific adhesion to flat substrates via both costameric and focal adhesions. The general appearance of the contractile and adhesion apparatus remains almost unaffected by substrate stiffness.

Keywords: Cardiomyocyte; Cell adhesion; Mechanoresponse; Myofibril; Sarcomere; Traction force microscopy.


Conflict of interest statement

Competing interests: The authors have no competing interests to declare.

Figures

Fig. 1.
Fig. 1.. Substrate elasticity dependent cell shape adaptation of myocytes.
Freshly isolated rat cardiomyocytes were incubated for 3 days on silicone rubber substrates ranging in their elasticity from ∼1 to 500 kPa as given. Subsequently, cells were analyzed for either round (shape index, si>0.8) or elongated, angular (si≤0.8) cell shape (A) using image processing. Left micrograph si = 0.96, right micrograph si = 0.45. Scale bars: 50 µm. Distribution between both shapes is given in B. Round cell shape  =  dark grey and elongated shaped cells  =  light grey. n  =  number of analyzed cells. Mean values (black) including s.d. (grey) of shape indices for round and elongated cells are given next to the bars.
Fig. 2.
Fig. 2.. Stable formation of the force generating system of myocytes.
Cardiomyocytes were grown on ∼1 kPa, 15 kPa and 500 kPa stiff elastomeric substrates for 3 days and analyzed after fixation for myofibril formation using α-actinin (left) and actin (middle) as marker proteins. Overlay images are given (right). Scale bars: 50 µm.
Fig. 3.
Fig. 3.. Substrate elasticity independent formation of costameres.
GFP-α-actinin transfected cells (A) were grown for 3 days on 15 kPa, 30 kPa and 90 kPa substrates. Live cell images were segmented using image processing (B). Scale bar: 10 µm. Mean α-actinin cluster size (C), relative coverage of cells with α-actinin clusters (D) and the total number of α-actinin clusters per cell (E) were determined. All results are indicated with their respective s.d.; n = 16 cells for 15 kPa, 20 cells for 30 kPa and 13 cells for 90 kPa.
Fig. 4.
Fig. 4.. Myofibril alignment and plasma membrane attachment.
Cardiomyocytes were grown for 3 days on substrates of indicated elasticities. Subsequently, cells were fixed and stained for plectin and actin (A) or vinculin and actin (B). Insets in A show enlargements of the areas within the white squares. Note the elasticity dependent reinforcement of plectin and vinculin around sites of z-bands. Scale bars: 20 µm.
Fig. 5.
Fig. 5.. Costameric and focal adhesion dependent traction forces of myocytes.
GFP-α-actinin transfected cardiomyocytes (A–E) and GFP-VASP transfected myofibroblasts (F–J) were grown on fluorescent bead micropatterned 15 kPa (exemplarily shown here), 30 kPa and 90 kPa elastomeric substrates. Spontaneously contracting myocytes were analyzed by live cell microscopy to visualize the substrate deformation field (A, green arrows) upon contraction. Using interactively chosen force induction points and elasticity theory cell forces (not shown) and the resulting back calculated substrate deformations (A, yellow arrows) were determined for each time point. As result we received a residual displacement vector for each marker bead (B–D, right, blue arrows). Choosing as force induction points (yellow squares) either FAs only (B), costameres only (C) or both together (D) back calculations reproduced the actual deformation field with very different accuracy. Frame rate = 17 Hz. As control, measured substrate deformations and back calculated substrate deformations of stably adhered myofibroblasts (F) were determined as described for myocytes using FAs (G), a lattice mimicking the length of two sarcomeres (∼4 µm) along stress fibers (H) and both (I) as force induction points. Here, for displacement calculation an image of the same substrate area was taken after cell removal. For each back calculation the normalized squared deviation (χ2) between fit result and measured data was determined as exemplarily given in E,J. Note that for myocytes residual deformations are low only if both FAs and costameres are taken as force induction points, while for myofibroblasts FAs alone are fully sufficient. Scale bars for displacements (yellow and green) in A,F: 0.5 µm; for the cell size (white): 10 µm; and for residual deformation (light blue): 0.2 µm.
Fig. 6.
Fig. 6.. Stiffness dependent force generation of myocytes.
After growth of myocytes for 3 days on bead micropatterned substrates (A) with elasticities ranging from ∼1 to 500 kPa (D), traction force microscopy was performed on spontaneously contracting cells. Applying elasticity theory based on substrate deformations (B, yellow arrows) with a hexagonal grid used as force induction points (A), forces per grid point (B, red arrows) were determined for every image of the time stack. Scale bars: 10 µm. The time course of the sum of all contractile forces for the exemplarily given cell is indicated (C). Maximum values of the sum of all contractile forces were averaged for all cells per substrate elasticity and are indicated with the respective s.d. in D using a logarithmic substrate stiffness scale. The dotted curve displays a fitted proportional force increase. The dashed curve indicates a fitted linear force increase. n≥15 cells per elasticity.
Fig. 7.
Fig. 7.. Force fields along the contractile apparatus.
GFP-α-actinin transfected myocytes (A) were grown for 3 days on bead micropatterned substrates with elasticities as indicated in (D). Substrate deformation fields were determined (B) and entire force fields were retrieved (C). Scale bar: 10 µm. The sum of all maximum contractile forces were averaged over all cells analyzed per substrate elasticity and are indicated with the respective s.d. in D using a logarithmic substrate stiffness scale. The dotted curve displays a fitted proportional force increase. The dashed curve indicates a fitted linear force increase. n≥20 cells per elasticity.
Fig. 8.
Fig. 8.. Constant sarcomeric contractile strain upon substrate stiffening.
Contraction of individual myofibrils of GFP-α-actinin transfected cells was analyzed over time along a line spanning their full length (A, left) and plotted as time–space plot (A, right; black arrow indicates direction of time). Scale bar: 10 µm. Gray values along the myofibril at relaxed (t1) and contracted state (t2) show displacements towards the center (black arrowhead in B,C) of the myofibril and enable calculation of displacements of z-bands along the myofibril (C). Note the almost linear dependence of displacement on position in the inner half of the myofibril. Fitted lines characterizing the linear displacement section were averaged over 2–4 independent myofibrils per cell. The resulting slopes (D) describe the average myofibril contractility of each cell on 15 kPa substrates (n = 7), 30 kPa (n = 13) and 90 kPa (n = 8). Mean contractile myofibril strain averaged over all cells per elasticity is given as straight line and separately in (D), bottom right, with included s.d.

References

    1. Anazawa T., Yasuda K., Ishiwata S. (1992). Spontaneous oscillation of tension and sarcomere length in skeletal myofibrils. Microscopic measurement and analysis. Biophys. J. 61, 1099–1108 10.1016/S0006-3495(92)81919-7 - DOI - PMC - PubMed
    1. Bajaj P., Tang X., Saif T. A., Bashir R. (2010). Stiffness of the substrate influences the phenotype of embryonic chicken cardiac myocytes. J. Biomed. Mater. Res. A 95A, 1261–1269 10.1002/jbm.a.32951 - DOI - PubMed
    1. Balaban N. Q., Schwarz U. S., Riveline D., Goichberg P., Tzur G., Sabanay I., Mahalu D., Safran S., Bershadsky A., Addadi L.et al. (2001). Force and focal adhesion assembly: a close relationship studied using elastic micropatterned substrates. Nat. Cell Biol. 3, 466–472 10.1038/35074532 - DOI - PubMed
    1. Bennett P. M. (2012). From myofibril to membrane; the transitional junction at the intercalated disc. Front. Biosci. 17, 1035–1050 10.2741/3972 - DOI - PubMed
    1. Bennett P. M., Maggs A. M., Baines A. J., Pinder J. C. (2006). The transitional junction: a new functional subcellular domain at the intercalated disc. Mol. Biol. Cell 17, 2091–2100 10.1091/mbc.E05-12-1109 - DOI - PMC - PubMed