. 2013 May;41(9):4743-54.
doi: 10.1093/nar/gkt178. Epub 2013 Mar 21.

Translating mRNAs strongly correlate to proteins in a multivariate manner and their translation ratios are phenotype specific

Affiliations

Translating mRNAs strongly correlate to proteins in a multivariate manner and their translation ratios are phenotype specific

Tong Wang et al. Nucleic Acids Res. 2013 May.

Abstract

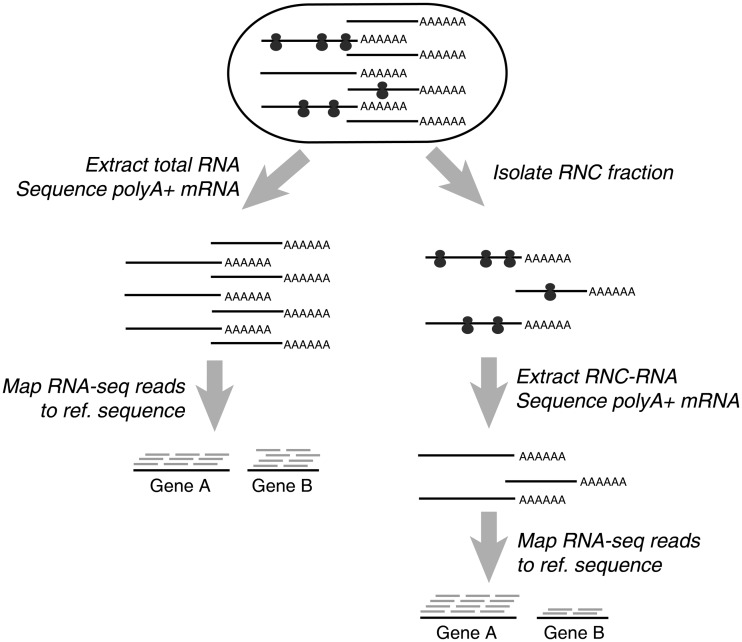
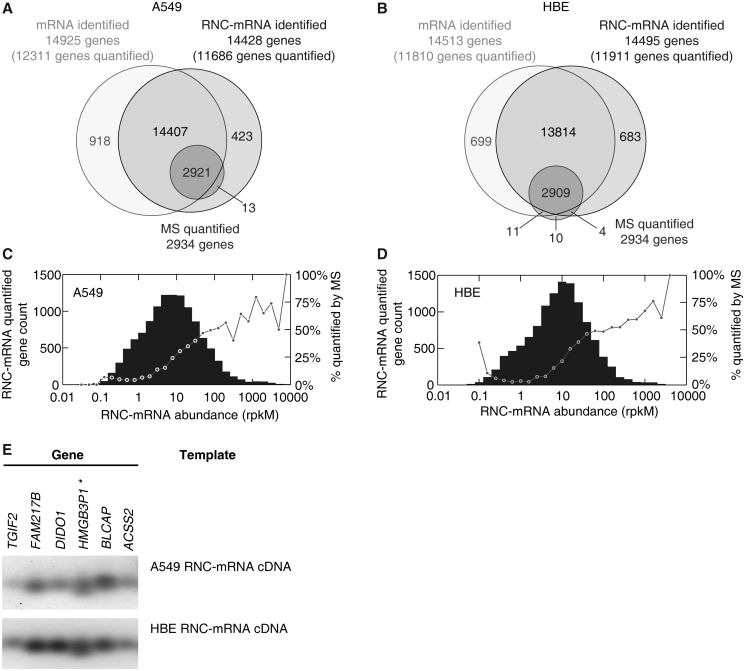
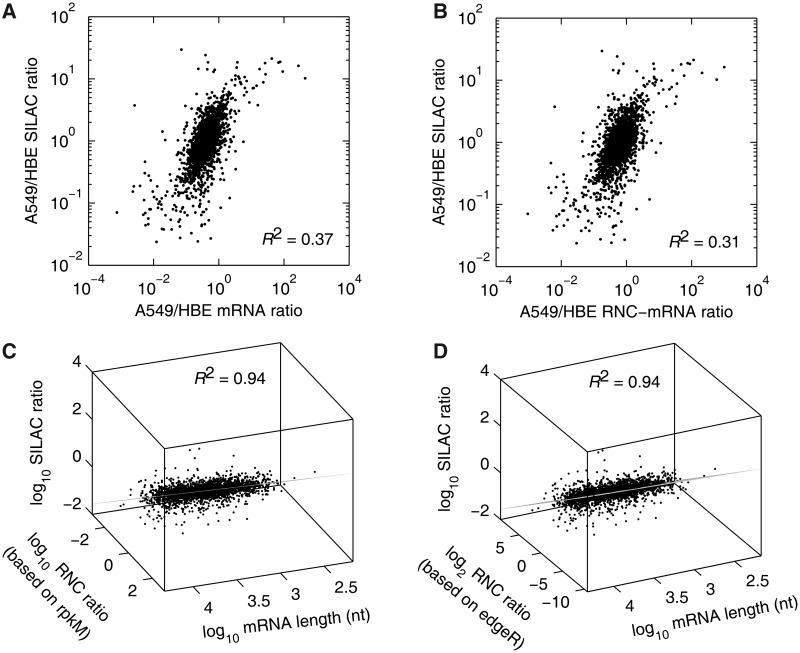
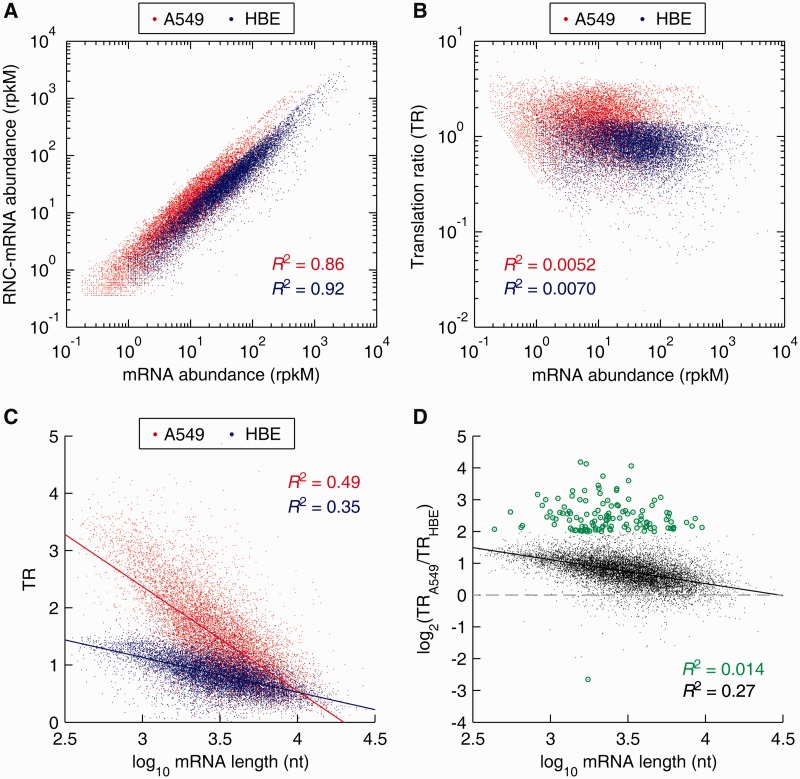
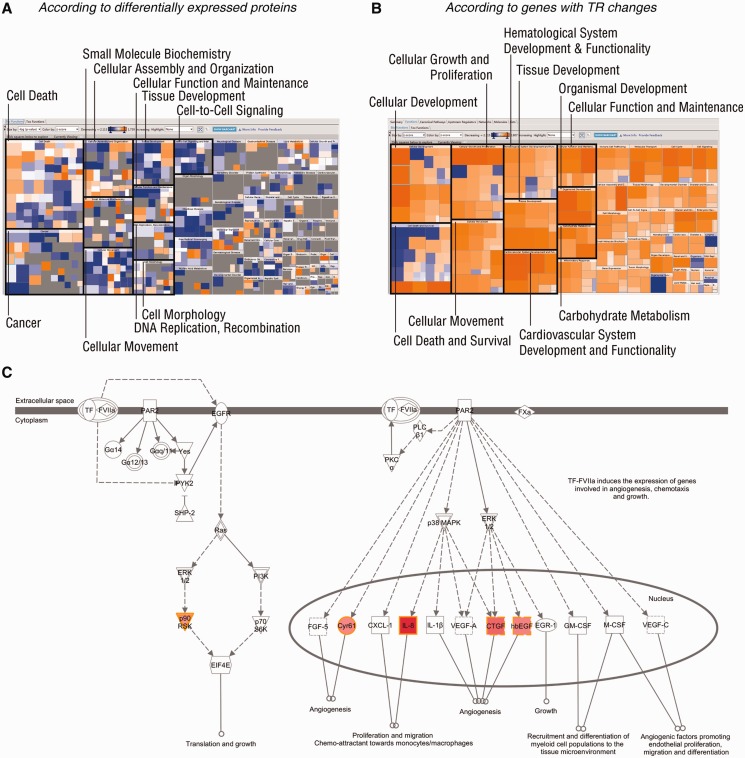
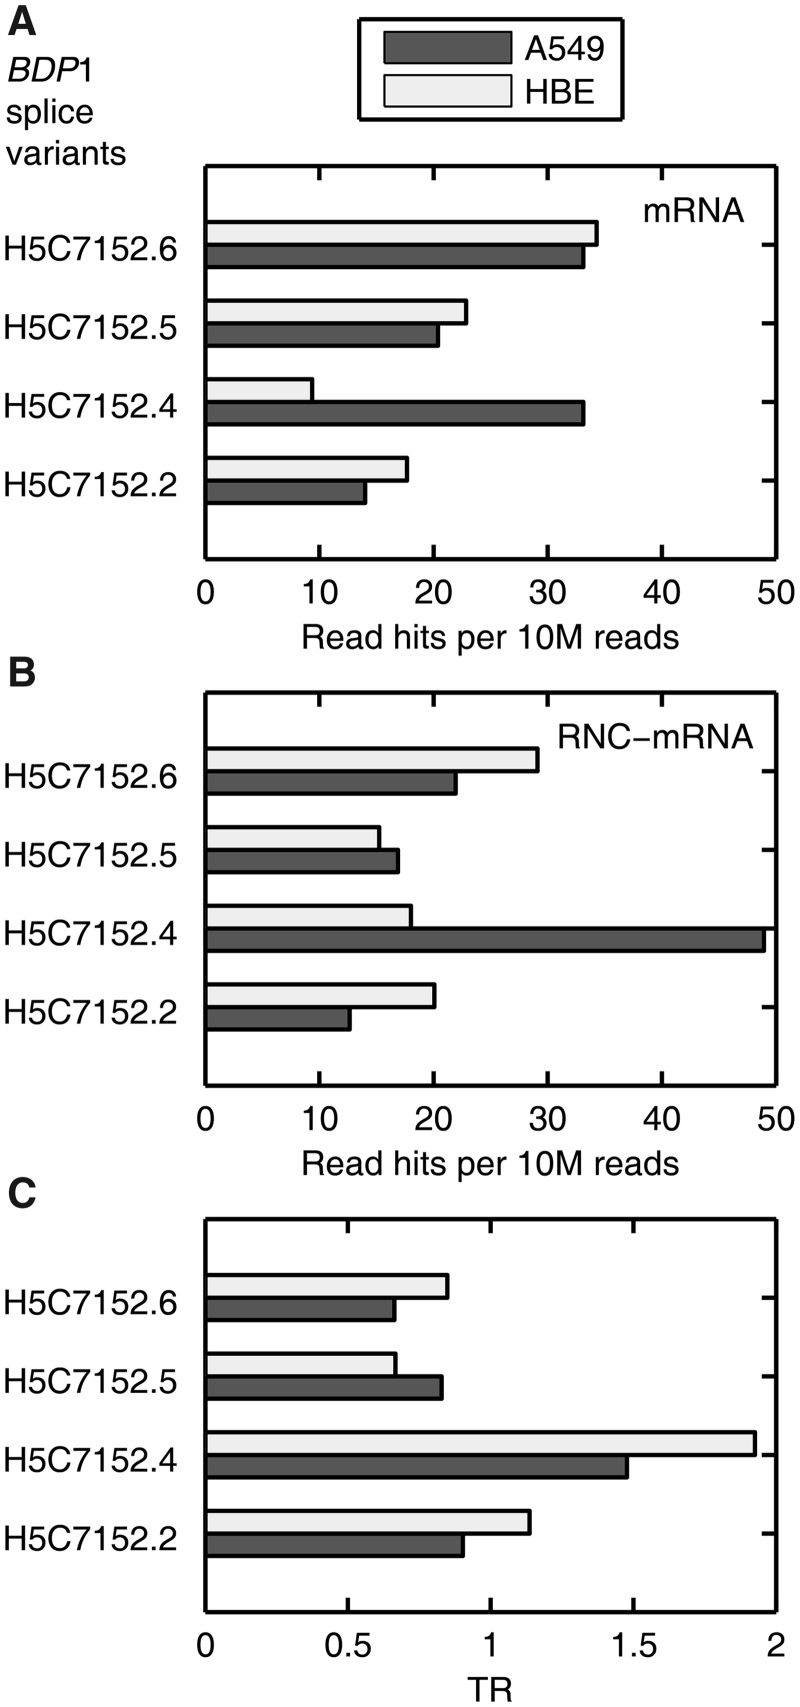
As a well-known phenomenon, total mRNAs poorly correlate to proteins in their abundances as reported. Recent findings calculated with bivariate models suggested even poorer such correlation, whereas focusing on the translating mRNAs (ribosome nascent-chain complex-bound mRNAs, RNC-mRNAs) subset. In this study, we analysed the relative abundances of mRNAs, RNC-mRNAs and proteins on genome-wide scale, comparing human lung cancer A549 and H1299 cells with normal human bronchial epithelial (HBE) cells, respectively. As discovered, a strong correlation between RNC-mRNAs and proteins in their relative abundances could be established through a multivariate linear model by integrating the mRNA length as a key factor. The R(2) reached 0.94 and 0.97 in A549 versus HBE and H1299 versus HBE comparisons, respectively. This correlation highlighted that the mRNA length significantly contributes to the translational modulation, especially to the translational initiation, favoured by its correlation with the mRNA translation ratio (TR) as observed. We found TR is highly phenotype specific, which was substantiated by both pathway analysis and biased TRs of the splice variants of BDP1 gene, which is a key transcription factor of transfer RNAs. These findings revealed, for the first time, the intrinsic and genome-wide translation modulations at translatomic level in human cells at steady-state, which are tightly correlated to the protein abundance and functionally relevant to cellular phenotypes.


Figures

Figure 1.
Figure 1.
Schematic procedure for translatome and transcriptome sequencing.
Figure 2.
Figure 2.
Gene identification in translatome and transcriptome sequencing, in comparison with SILAC-based mass spectrometry. (A and B) Number of genes and proteins identified with RNA-seq (lighter circles) and MS (dark circle), respectively, in A549 cells (A) and HBE cells (B). (C and D) RNC-mRNA abundance distribution in A549 cells (C) and HBE cells (D). Genes were step-wise classified, based on abundances of quantified RNC-mRNA. Each bar indicates gene number of detection in its respective category. In each category, the percentage of the number of MS quantifiable protein to the number of genes that are detected by RNC-mRNA sequencing is shown with a dot. (E) Validation of gene detection in RNC-mRNA, extracted from A549 and HBE cells, respectively. Six randomly selected genes were subjected to RT-PCR assays and indicated by HGNC gene names.
Figure 3.
Figure 3.
Multivariate linear correlation among the relative abundances of mRNA, RNC-mRNA and protein. (A and B) Bivariate correlation comparing mRNA (A) and RNC-mRNA ratios (A549/HBE) (B) with SILAC ratio (A549/HBE), respectively. (C and D) Multivariate linear model, fitting SILAC ratio (A549/HBE), mRNA length and RNC-mRNA ratio (A549/HBE), calculated based on rpkM (C) and edgeR (D) normalizations regarding RNA-seq data. The viewpoints were on the fitted planes.
Figure 4.
Figure 4.
Distribution and correlation analysis of mRNA TRs, comparing A549 cells with HBE cells. (A) Correlation of mRNA and RNC-mRNA abundances in A549 and HBE cells, respectively. (B) Correlation of mRNA ratio (A549/HBE) and RNC-mRNA ratio (A549/HBE). (C) Correlation of TRs and mRNA lengths. (D) Correlation of TR fold changes (A549/HBE) and mRNA lengths. The genes with TR ratio changes greater than 4 folds are indicated by green dots.
Figure 5.
Figure 5.
IPA. DEPs and genes with considerable TR fold changes (A549/HBE) were subjected to IPA. (A and B) Heat maps of effects on biological processes, regulated by DEPs (A) and TR-changed genes (B). Top 10 Category Level I bioprocesses are indicated by black blocks. An orange square represents an enhanced Category Level II bioprocess with a positive z-score, provided by IPA, whereas suppressed such bioprocesses, with negative z-scores, are shown in blue squares. Insignificant bioprocesses are indicated by grey squares. (C) The top canonical pathway regulated by TR-changed genes (A549/HBE). Experimentally detected genes are indicated in red shapes, and the colour intensity represents the grade of regulation. Shapes of inversed triangles, circles and squares represent kinases, complexes and cytokines, respectively. Solid and dashed lines with arrows represent direct and indirect promotion, respectively. Full names of the genes (HGNC nomenclature) in red shapes are protease-activated kinase II (p90RSK), cysteine-rich angiogenic inducer 61 (Cyr61), interleulin-8 (IL-8), connective tissue growth factor (CTGF) and heparin-binding EGF-like growth factor (hbEGF).
Figure 6.
Figure 6.
Biased TRs of BDP1 splice variants in A549 and HBE cells. (A and B) BDP1 splice variants detected in mRNA (A) and RNC-mRNA (B) of A549 and HBE cells, respectively. The bars represent the normalized number of reads that were mapped to specific splicing junctions of different variants. (C) TR of these splice variants in A549 and HBE cells, respectively.

References

    1. Gygi SP, Rochon Y, Franza BR, Aebersold R. Correlation between protein and mRNA abundance in yeast. Mol. Cell Biol. 1999;19:1720–1730. - PMC - PubMed
    1. Chen G, Gharib TG, Huang CC, Taylor JM, Misek DE, Kardia SL, Giordano TJ, Iannettoni MD, Orringer MB, Hanash SM, et al. Discordant protein and mRNA expression in lung adenocarcinomas. Mol. Cell Proteomics. 2002;1:304–313. - PubMed
    1. Lu P, Vogel C, Wang R, Yao X, Marcotte EM. Absolute protein expression profiling estimates the relative contributions of transcriptional and translational regulation. Nat. Biotechnol. 2007;25:117–124. - PubMed
    1. Guo Y, Xiao P, Lei S, Deng F, Xiao GG, Liu Y, Chen X, Li L, Wu S, Chen Y, et al. How is mRNA expression predictive for protein expression? A correlation study on human circulating monocytes. Acta. Biochim. Biophys. Sin. 2008;40:426–436. - PubMed
    1. Taniguchi Y, Choi PJ, Li GW, Chen H, Babu M, Hearn J, Emili A, Xie XS. Quantifying E. coli proteome and transcriptome with single-molecule sensitivity in single cells. Science. 2010;329:533–538. - PMC - PubMed

Publication types

MeSH terms