. 2013 Apr;69(Pt 4):625-34.
doi: 10.1107/S0907444913000462. Epub 2013 Mar 14.

Bulk-solvent and overall scaling revisited: faster calculations, improved results

Affiliations

Bulk-solvent and overall scaling revisited: faster calculations, improved results

P V Afonine et al. Acta Crystallogr D Biol Crystallogr. 2013 Apr.

Erratum in

Abstract

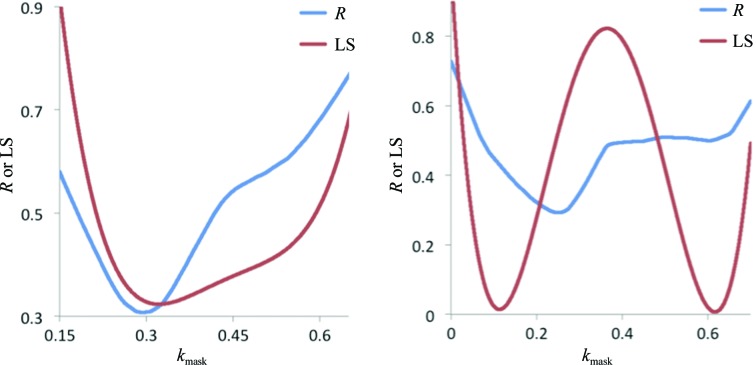
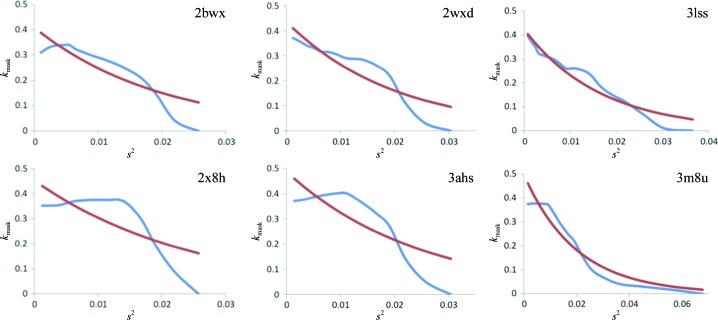
A fast and robust method for determining the parameters for a flat (mask-based) bulk-solvent model and overall scaling in macromolecular crystallographic structure refinement and other related calculations is described. This method uses analytical expressions for the determination of optimal values for various scale factors. The new approach was tested using nearly all entries in the PDB for which experimental structure factors are available. In general, the resulting R factors are improved compared with previously implemented approaches. In addition, the new procedure is two orders of magnitude faster, which has a significant impact on the overall runtime of refinement and other applications. An alternative function is also proposed for scaling the bulk-solvent model and it is shown that it outperforms the conventional exponential function. Similarly, alternative methods are presented for anisotropic scaling and their performance is analyzed. All methods are implemented in the Computational Crystallography Toolbox (cctbx) and are used in PHENIX programs.

Keywords: PHENIX; anisotropy; bulk solvent; scaling; structure refinement.


Figures

Figure 1
Figure 1
Examples of smoothening of k mask. The original k mask (blue; obtained as the solution of equation 29) and that after smoothening (red) are shown for three PDB entries with the PDB codes shown on the plots.
Figure 2
Figure 2
Flowchart of the logarithmic resolution-binning algorithm.
Figure 3
Figure 3
A comparison of the new scaling protocol using different models for the anisotropic scale factor. R versus R factor scatter plots for (a) poly versus expanal, (b) poly versus expmin and (c) expanal versus expmin R factors were computed using all reflections (left), low-resolution reflections only (middle) and high-resolution reflections only (right). See §3.3 for details.
Figure 4
Figure 4
R versus R factor scatter plots comparing the new scaling protocol using poly+expanal for the anisotropic scale factor with the old protocol. For each structure the full set of structure factors available from the PDB was used to calculate scale factors and to calculate R factors (left). Using the same scale-factor values the R factors were calculated separately for the low-resolution reflections (middle) and high-resolution reflections (right). A large spread of points in the vertical direction above the diagonal (red line) in these latter plots indicates that in many cases the scale factors produced by the old protocol resulted in a poorer fit to the data at low and high resolutions, while the new protocol generates scale factors with a good fit across all resolution ranges. See §3.3 for details.
Figure 5
Figure 5
Plots of R factors (with k isotropic = 0.0961) and the LS function (with k isotropic = 0.0863) for PDB entry 1kwn (left) and R factors (with k isotropic = 0.0131) and the LS function (with k isotropic = 0.0151) for PDB entry 1hqw (right), illustrating that the minima of the R-factor function (46) and the LS function (22) can be at significantly different locations in parameter space. In such cases, a line search around the value of k mask obtained by minimization of the LS function is necessary in order to obtain a value that minimizes the R factor. For plotting purposes, the values of the LS function were scaled to be similar to the R factors.
Figure 6
Figure 6
Plots of k mask as a function of resolution (s 2) for six selected PDB entries. The blue lines show k mask as determined using the new method. The red lines show k mask based on the exponential function (10) using optimized k sol and B sol parameters.

References

    1. Adams, P. D. et al. (2010). Acta Cryst. D66, 213–221. - PubMed
    1. Afonine, P. V., Grosse-Kunstleve, R. W. & Adams, P. D. (2005a). Acta Cryst. D61, 850–855. - PMC - PubMed
    1. Afonine, P. V., Grosse-Kunstleve, R. W. & Adams, P. D. (2005b). CCP4 Newsl. Protein Crystallogr. 42, contribution 8.
    1. Afonine, P. V., Grosse-Kunstleve, R. W., Chen, V. B., Headd, J. J., Moriarty, N. W., Richardson, J. S., Richardson, D. C., Urzhumtsev, A., Zwart, P. H. & Adams, P. D. (2010). J. Appl. Cryst. 43, 669–676. - PMC - PubMed
    1. Afonine, P. V., Grosse-Kunstleve, R. W., Echols, N., Headd, J. J., Moriarty, N. W., Mustyakimov, M., Terwilliger, T. C., Urzhumtsev, A., Zwart, P. H. & Adams, P. D. (2012). Acta Cryst. D68, 352–367. - PMC - PubMed

Publication types