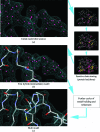
Visual automated macromolecular model building
- PMID: 23519672
- PMCID: PMC3606041
- DOI: 10.1107/S0907444913000565
Visual automated macromolecular model building
Abstract
Automated model-building software aims at the objective interpretation of crystallographic diffraction data by means of the construction or completion of macromolecular models. Automated methods have rapidly gained in popularity as they are easy to use and generate reproducible and consistent results. However, the process of model building has become increasingly hidden and the user is often left to decide on how to proceed further with little feedback on what has preceded the output of the built model. Here, ArpNavigator, a molecular viewer tightly integrated into the ARP/wARP automated model-building package, is presented that directly controls model building and displays the evolving output in real time in order to make the procedure transparent to the user.
Keywords: ARP/wARP; model building; molecular graphics.
Figures


Similar articles
-
Automated macromolecular model building for X-ray crystallography using ARP/wARP version 7.Nat Protoc. 2008;3(7):1171-9. doi: 10.1038/nprot.2008.91. Nat Protoc. 2008. PMID: 18600222 Free PMC article.
-
The accuracy of protein models automatically built into cryo-EM maps with ARP/wARP.Acta Crystallogr D Struct Biol. 2021 Feb 1;77(Pt 2):142-150. doi: 10.1107/S2059798320016332. Epub 2021 Jan 26. Acta Crystallogr D Struct Biol. 2021. PMID: 33559604 Free PMC article.
-
Assessment of automatic ligand building in ARP/wARP.Acta Crystallogr D Biol Crystallogr. 2007 Jan;63(Pt 1):108-17. doi: 10.1107/S0907444906023389. Epub 2006 Dec 13. Acta Crystallogr D Biol Crystallogr. 2007. PMID: 17164533 Free PMC article.
-
Computationally focusing the directed evolution of proteins.J Cell Biochem Suppl. 2001;Suppl 37:58-63. doi: 10.1002/jcb.10066. J Cell Biochem Suppl. 2001. PMID: 11842429 Review.
-
Boxes of Model Building and Visualization.Methods Mol Biol. 2017;1607:491-548. doi: 10.1007/978-1-4939-7000-1_21. Methods Mol Biol. 2017. PMID: 28573587 Review.
Cited by
-
Electrochemical and Structural Study of the Buried Tryptophan in Azurin: Effects of Hydration and Polarity on the Redox Potential of W48.J Phys Chem B. 2023 Jan 12;127(1):133-143. doi: 10.1021/acs.jpcb.2c06677. Epub 2022 Dec 21. J Phys Chem B. 2023. PMID: 36542812 Free PMC article.
-
Haruspex: A Neural Network for the Automatic Identification of Oligonucleotides and Protein Secondary Structure in Cryo-Electron Microscopy Maps.Angew Chem Int Ed Engl. 2020 Aug 24;59(35):14788-14795. doi: 10.1002/anie.202000421. Epub 2020 May 11. Angew Chem Int Ed Engl. 2020. PMID: 32187813 Free PMC article.
-
Automated identification of crystallographic ligands using sparse-density representations.Acta Crystallogr D Biol Crystallogr. 2014 Jul;70(Pt 7):1844-53. doi: 10.1107/S1399004714008578. Epub 2014 Jun 29. Acta Crystallogr D Biol Crystallogr. 2014. PMID: 25004962 Free PMC article.
-
A unique network of attack, defence and competence on the outer membrane of the periodontitis pathogen Tannerella forsythia.Chem Sci. 2022 Dec 12;14(4):869-888. doi: 10.1039/d2sc04166a. eCollection 2023 Jan 25. Chem Sci. 2022. PMID: 36755705 Free PMC article.
-
The first crystal structures of RNA-PNA duplexes and a PNA-PNA duplex containing mismatches--toward anti-sense therapy against TREDs.Nucleic Acids Res. 2016 Feb 29;44(4):1937-43. doi: 10.1093/nar/gkv1513. Epub 2015 Dec 29. Nucleic Acids Res. 2016. PMID: 26717983 Free PMC article.
References
MeSH terms
Substances
LinkOut - more resources
Full Text Sources
Other Literature Sources
Miscellaneous

