. 2013 Sep;114(9):1997-2006.
doi: 10.1002/jcb.24542.

Cell-cycle specific association of transcription factors and RNA polymerase ii with the human β-globin gene locus

Affiliations

Cell-cycle specific association of transcription factors and RNA polymerase ii with the human β-globin gene locus

Michael Rosenberg et al. J Cell Biochem. 2013 Sep.

Abstract

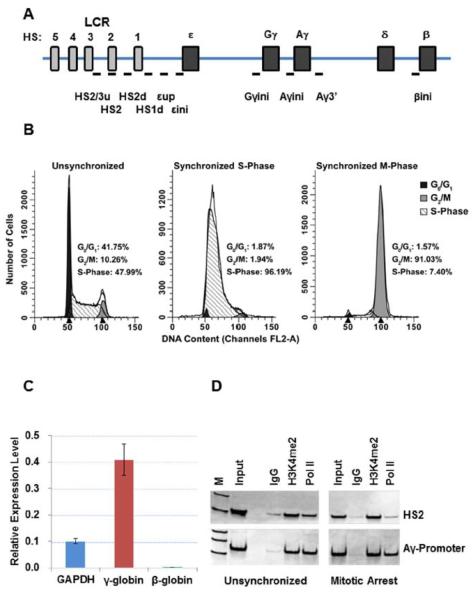
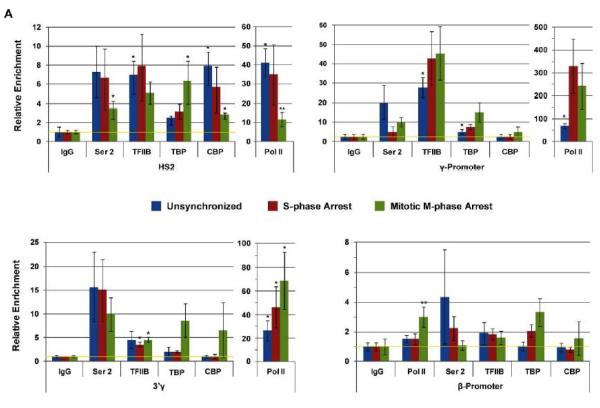
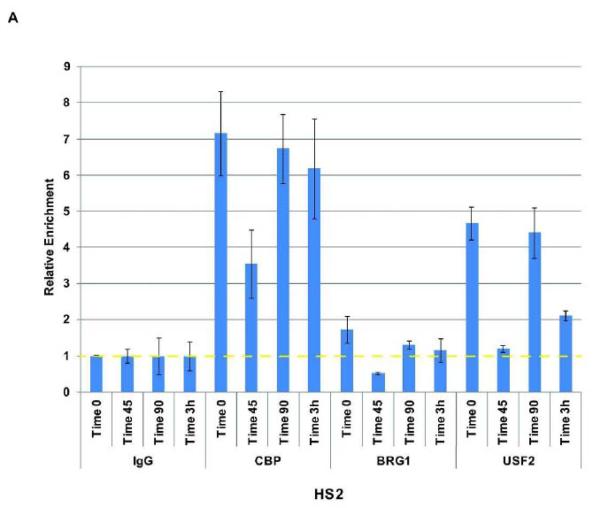
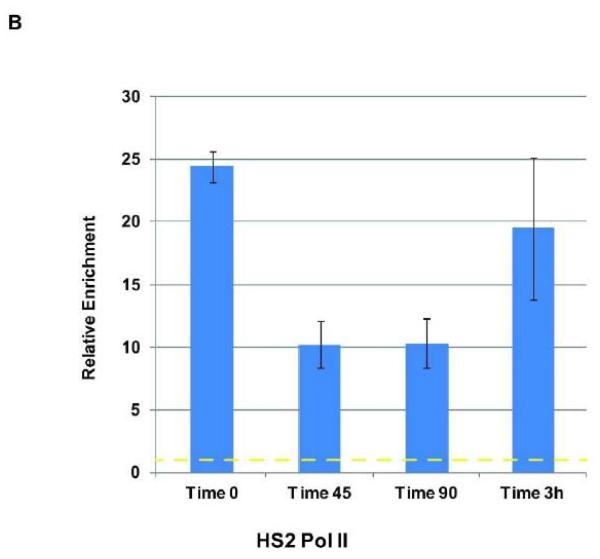
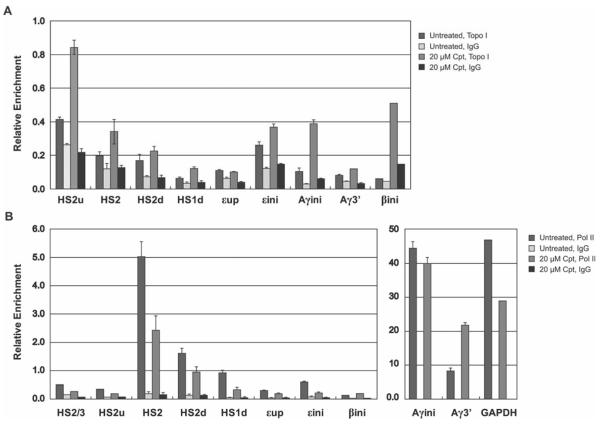
The human β-globin genes are regulated by a locus control region (LCR) and are expressed at extremely high levels in erythroid cells. How transcriptional fidelity of highly expressed genes is regulated and maintained during the cell cycle is not completely understood. Here, we analyzed the association of transcription factor USF, the co-activator CBP, topoisomerase I (Topo I), basal transcription factor TFIIB, and RNA polymerase II (Pol II) with the β-globin gene locus at specific cell-cycle stages. The data demonstrate that while association of Pol II with globin locus associated chromatin decreased in mitotically arrested cells, it remained bound at lower levels at the γ-globin gene promoter. During early S-phase, association of CBP, USF, and Pol II with the globin gene locus decreased. The re-association of CBP and USF2 with the LCR preceded re-association of Pol II, suggesting that these proteins together mediate recruitment of Pol II to the β-globin gene locus during S-phase. Finally, we analyzed the association of Topo I with the globin gene locus during late S-phase. In general, Topo I association correlated with the binding of Pol II. Inhibition of Topo I activity reduced Pol II binding at the LCR and intergenic regions but not at the γ-globin gene promoter. The data demonstrate dynamic associations of transcription factors with the globin gene locus during the cell cycle and support previous results showing that specific components of transcription complexes remain associated with highly transcribed genes during mitosis.

Keywords: CELL CYCLE; GLOBIN GENE LOCUS; MITOSIS; RNA POLYMERASE II; TRANSCRIPTION FACTOR.


Figures

Figure 1
Figure 1
A. Diagram of the human β-globin gene locus indicating the position of genes and LCR HS sites. Small bars indicate the position of PCR-amplicons analyzed in this study. These regions are as follows: HS2/3/u, two sets of primers in the linker region between HS3 and HS2; HS2, core region of HS2; HS2d, a region between HS2 and HS1; HS1d, a region downstream of HS1; εup, a region between HS1 and ε-globin; εini, a region overlapping the transcription initiation site of the ε-globin gene; Gγini, a region overlapping the transcription start site of the Gγ-globin gene; Aγini, a region overlapping the transcription start site of the Aγ-globin gene; Aγ3', a region at the 3'end of the Aγ-globin gene, βini, a region overlapping the transcription start site of the β-globin gene. B. Flow cytometry analysis of unsynchronized, synchronized at the G1/S-phase border, and M-phase arrested K562 cells. The cells were arrested at the G1/S-phase border (labeled as Synchronized S-Phase) using the double thymidine method, then released from the block and arrested in M-phase using nocodazole (labeled as Synchronized M-Phase). C. Analysis of GAPDH, γ-globin, and β-globin gene expression by reverse transcription (RT) qPCR. The data represent means +/− standard error of the means of results from two experiments. D. ChIP analysis of of the interaction of H3K4me2 and Pol II with HS2 and the Ay-globin promoter (Aγini). ChIP enriched DNA was amplified with the indicated primers and electrophoresed on TBE gels followed by staining with SYBR green.
Figure 2
Figure 2
Analysis of Pol II and transcription factor binding at the human β-globin gene locus in unsynchronized, synchronized (at the G1/S-border), and M-phase arrested cells. K562 cells were subjected to double thymidine block at G1/S-phase and nocodazole mediated arrest in early M-phase. Aliquots of the cells were taken from unsynchronized, G1/S-phase synchronized (indicated as S-phase arrest) and M-phase arrested (indicated as Mitotic arrest) cultures. The cells were subjected to ChIP assays using antibodies specific for Pol II, Pol II phosphorylated at serine 2 (indicated as Ser 2), TFII B, TBP, and CBP. Precipitation with IgG antibodies served as negative controls. The DNA was isolated from the immunoprecipitates and subjected to qPCR using primers specific for LCR element HS2, the Gγ-promoter region, the Aγ-3'end, and the β-globin promoter region. The data represent means +/− standard errors of the means of three independent experiments with PCR performed in duplicate. The data are shown relative to the IgG control, set at 1. The yellow line indicates IgG background levels.
Figure 3
Figure 3
Analysis of Pol II and transcription factor interaction with LCR element HS2 at different time points during S-phase. K562 cells were subjected to double thymidine block to arrest cells at the G1/S-phase border at which time point an aliquot was taken (Time 0). After the release from the block aliquots of cells were taken at different time points (45 min, 90 min, and 3 hrs, as indicated). The cells were subjected to ChIP analysis using antibodies specific for CBP, BRG1, USF2 (A), and Pol II (B). Precipitation with IgG antibodies served as negative controls in these experiments and the data were compared to the IgG samples which were set at 1. The bars represent the results of a single ChIP experiment with the qPCR performed in triplicate. Data are represented as the means +/− standard error of the means. Independent experiments yielded qualitatively similar data. The dotted yellow lines represent IgG background levels.
Figure 3
Figure 3
Analysis of Pol II and transcription factor interaction with LCR element HS2 at different time points during S-phase. K562 cells were subjected to double thymidine block to arrest cells at the G1/S-phase border at which time point an aliquot was taken (Time 0). After the release from the block aliquots of cells were taken at different time points (45 min, 90 min, and 3 hrs, as indicated). The cells were subjected to ChIP analysis using antibodies specific for CBP, BRG1, USF2 (A), and Pol II (B). Precipitation with IgG antibodies served as negative controls in these experiments and the data were compared to the IgG samples which were set at 1. The bars represent the results of a single ChIP experiment with the qPCR performed in triplicate. Data are represented as the means +/− standard error of the means. Independent experiments yielded qualitatively similar data. The dotted yellow lines represent IgG background levels.
Figure 4
Figure 4. Analysis of Topo I and Pol II binding with specific region in the β-globin gene locus in camptothecin treated K562 at late S-phase
Quantitative PCR results of ChIP assays of Topo I (upper graph) and Pol II (lower graph) binding to the β-globin locus in synchronized K562 cells, untreated (no drug) or treated with 20μM of camptothecin (Cpt) for 1hour. Cells were cross-linked with formaldehyde and the chromatin was isolated, fragmented, and precipitated with antibodies against Topo I, Pol II, or the unspecific IgG antibody. DNA was purified from the precipitate and analyzed by quantitative PCR using primers specific for the indicated regions in the LCR, intergenic region, and promoters of ε-globin, γ-globin, and β-globin in the β-globin locus (the amplicons are indicated in the diagram shown in Fig. 1A: HS2/3, LCR HS2 and HS3 linker region; HS2u, HS2 5' flanking region; HS2, HS2 core; HS2d, HS2 downstream region; HS1d, HS1 downstream region; εup: ε-globin gene upstream region; εini, ε-globin promoter; Aγini, Aγ-globin promoter; Aγ3', Aγ-globin gene 3' region; βini, β-globin promoter; GAPDH, GAPDH promoter region.). Bars represent the relative enrichment over the input DNA. Error bars represent standard deviation from two independent experiments.

Similar articles

Cited by

  • DNA topology and transcription.
    Kouzine F, Levens D, Baranello L. Kouzine F, et al. Nucleus. 2014 May-Jun;5(3):195-202. doi: 10.4161/nucl.28909. Epub 2014 Apr 22. Nucleus. 2014. PMID: 24755522 Free PMC article. Review.

References

    1. Amrolia PJ, Ramamurthy L, Saluja D, Tanese N, Jane SM, Cunningham JM. The activation domain of the enhancer binding protein p45NF-E2 interacts with TAFII130 and mediates long-range activation of the alpha- and beta-globin gene loci in an erythroid cell line. Proc Nat Acad Sci USA. 1997;94:10051–10056. - PMC - PubMed
    1. Bermejo R, Capra T, Gonzales-Huici V, Fachinetti D, Cocito A, Natoli G, Katou Y, Mori H, Kurokawa K, Shirahige K, Foiani M. Genome-organizing factors Top2 and Hmo1 prevent chromosome fragility at sites of S-phase transcription. Cell. 2009;123:870–884. - PubMed
    1. Blobel GA, Kadauke S, Wang E, Lau AW, Zuber J, Chou MM, Vakoc CR. A reconfigured pattern of MLL occupancy within mitotic chromatin promotes rapid transcriptional reactivation following mitotic exit. Mol Cell. 2009;36:970–983. - PMC - PubMed
    1. Bulger M, Groudine M. Looping versus linking: toward a model for long-distance gene activation. Genes Dev. 1999;13:2465–77. - PubMed
    1. Buratowski S, Kim T. The role of cotranscriptional histone methylations. Cold Spring Harb Symp Quant Biol. 2010;75:95–102. - PMC - PubMed

Publication types

LinkOut - more resources