

Segmentation of individual renal cysts from MR images in patients with autosomal dominant polycystic kidney disease
- PMID: 23520042
- PMCID: PMC3700699
- DOI: 10.2215/CJN.10561012
Segmentation of individual renal cysts from MR images in patients with autosomal dominant polycystic kidney disease
Abstract
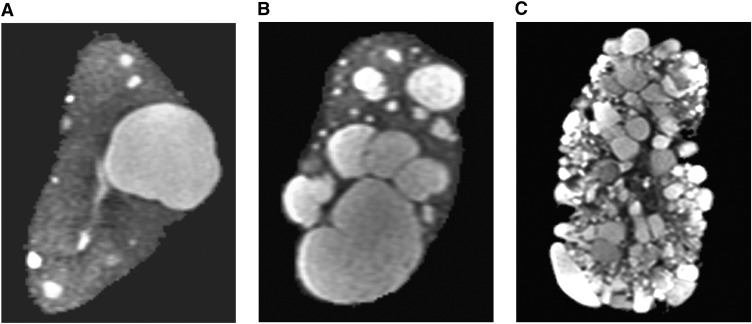
Objective: To evaluate the performance of a semi-automated method for the segmentation of individual renal cysts from magnetic resonance (MR) images in patients with autosomal dominant polycystic kidney disease (ADPKD).
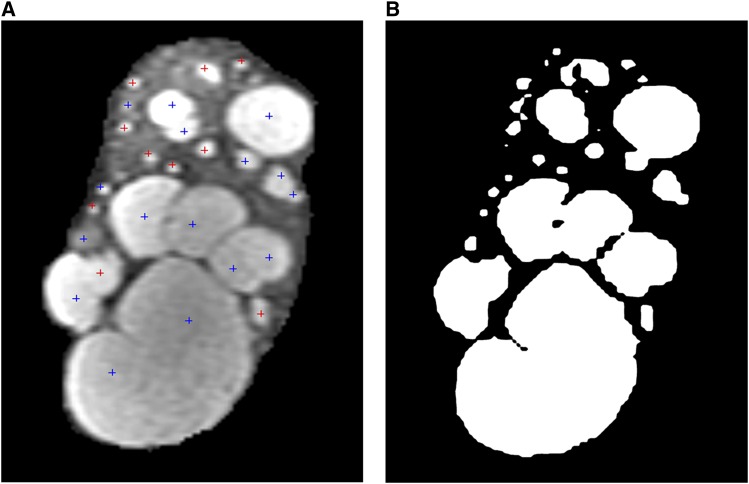
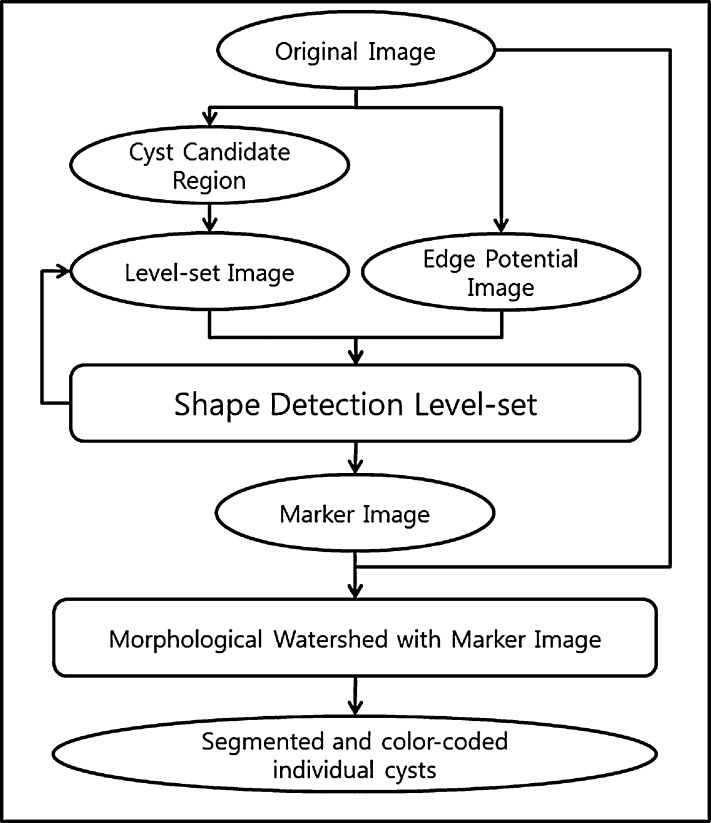
Design, setting, participants, & measurements: This semi-automated method was based on a morphologic watershed technique with shape-detection level set for segmentation of renal cysts from MR images. T2-weighted MR image sets of 40 kidneys were selected from 20 patients with mild to moderate renal cyst burden (kidney volume < 1500 ml) in the Consortium for Radiologic Imaging Studies of Polycystic Kidney Disease (CRISP). The performance of the semi-automated method was assessed in terms of two reference metrics in each kidney: the total number of cysts measured by manual counting and the total volume of cysts measured with a region-based thresholding method. The proposed and reference measurements were compared using intraclass correlation coefficient (ICC) and Bland-Altman analysis.
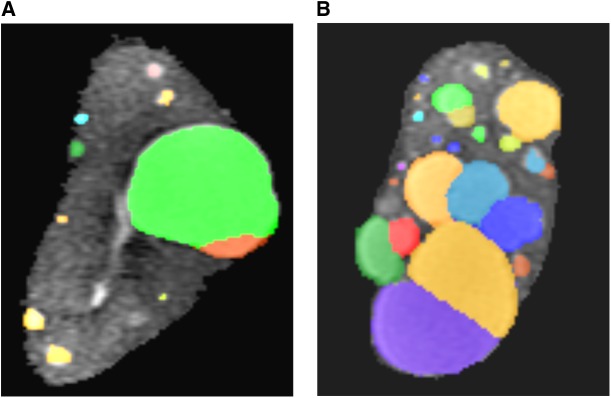
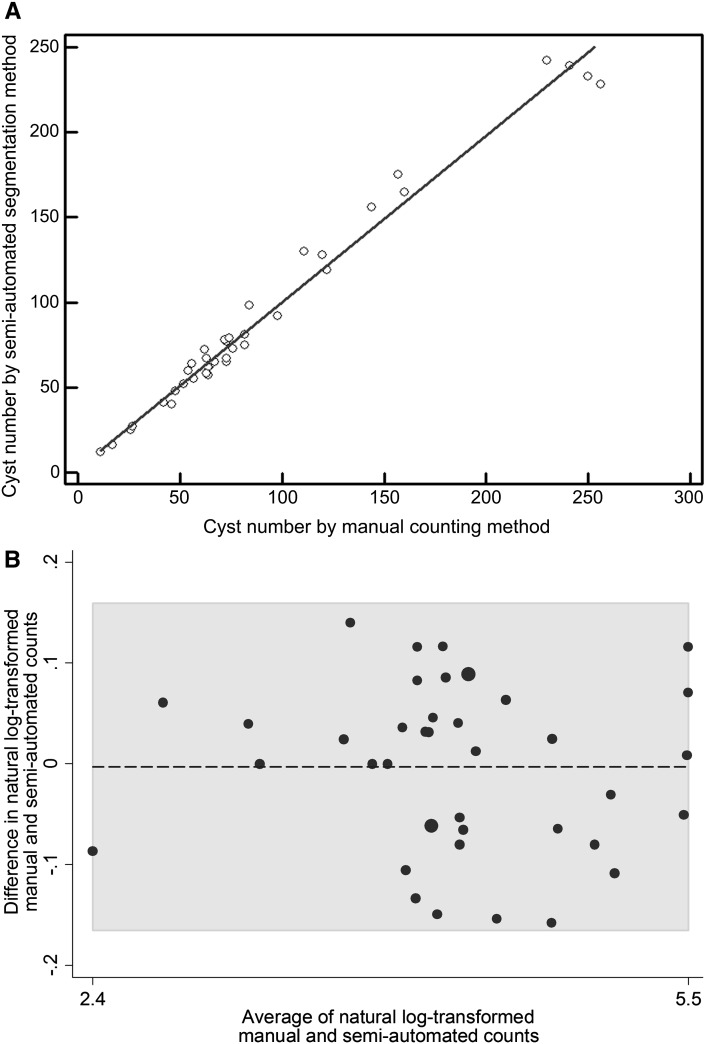
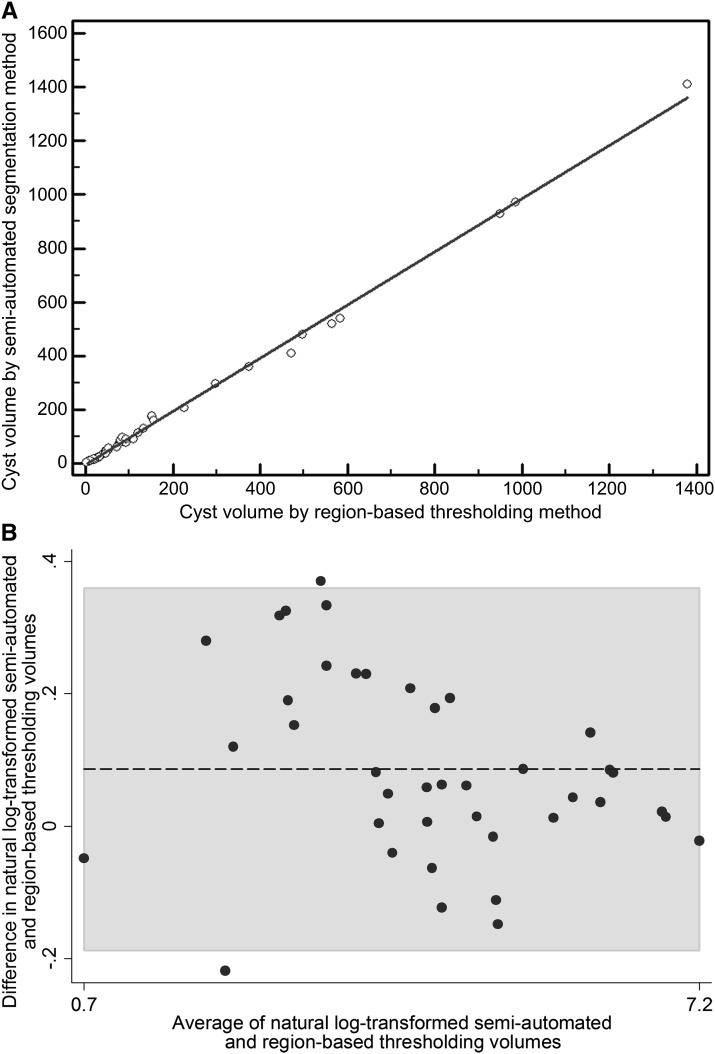
Results: Individual renal cysts were successfully segmented with the semi-automated method in all 20 cases. The total number of cysts in each kidney measured with the two methods correlated well (ICC, 0.99), with a very small relative bias (0.3% increase with the semi-automated method; limits of agreement, 15.2% reduction to 17.2% increase). The total volume of cysts measured using both methods also correlated well (ICC, 1.00), with a small relative bias of <10% (9.0% decrease in the semi-automated method; limits of agreement, 17.1% increase to 43.3% decrease).
Conclusion: This semi-automated method to segment individual renal cysts in ADPKD kidneys provides a quantitative indicator of severity in early and moderate stages of the disease.
Trial registration: ClinicalTrials.gov NCT01039987.
Figures
Similar articles
-
Automated segmentation of liver and liver cysts from bounded abdominal MR images in patients with autosomal dominant polycystic kidney disease.Phys Med Biol. 2016 Nov 21;61(22):7864-7880. doi: 10.1088/0031-9155/61/22/7864. Epub 2016 Oct 25. Phys Med Biol. 2016. PMID: 27779124 Free PMC article.
-
Novel methodology to evaluate renal cysts in polycystic kidney disease.Am J Nephrol. 2014;39(3):210-7. doi: 10.1159/000358604. Epub 2014 Feb 22. Am J Nephrol. 2014. PMID: 24576800 Free PMC article. Clinical Trial.
-
Automated Segmentation of Kidneys from MR Images in Patients with Autosomal Dominant Polycystic Kidney Disease.Clin J Am Soc Nephrol. 2016 Apr 7;11(4):576-84. doi: 10.2215/CJN.08300815. Epub 2016 Jan 21. Clin J Am Soc Nephrol. 2016. PMID: 26797708 Free PMC article.
-
Renal relevant radiology: radiologic imaging in autosomal dominant polycystic kidney disease.Clin J Am Soc Nephrol. 2014 Feb;9(2):406-15. doi: 10.2215/CJN.08940813. Epub 2013 Dec 26. Clin J Am Soc Nephrol. 2014. PMID: 24370765 Free PMC article. Review.
-
Approaches to testing new treatments in autosomal dominant polycystic kidney disease: insights from the CRISP and HALT-PKD studies.Clin J Am Soc Nephrol. 2008 Jul;3(4):1197-204. doi: 10.2215/CJN.00060108. Epub 2008 Jun 25. Clin J Am Soc Nephrol. 2008. PMID: 18579674 Review.
Cited by
-
Automated segmentation of liver and liver cysts from bounded abdominal MR images in patients with autosomal dominant polycystic kidney disease.Phys Med Biol. 2016 Nov 21;61(22):7864-7880. doi: 10.1088/0031-9155/61/22/7864. Epub 2016 Oct 25. Phys Med Biol. 2016. PMID: 27779124 Free PMC article.
-
A rapid high-performance semi-automated tool to measure total kidney volume from MRI in autosomal dominant polycystic kidney disease.Eur Radiol. 2019 Aug;29(8):4188-4197. doi: 10.1007/s00330-018-5918-9. Epub 2019 Jan 21. Eur Radiol. 2019. PMID: 30666443 Free PMC article.
-
Quantification of angiotensin II-regulated proteins in urine of patients with polycystic and other chronic kidney diseases by selected reaction monitoring.Clin Proteomics. 2016 Aug 5;13:16. doi: 10.1186/s12014-016-9117-x. eCollection 2016. Clin Proteomics. 2016. PMID: 27499720 Free PMC article.
-
Image texture features predict renal function decline in patients with autosomal dominant polycystic kidney disease.Kidney Int. 2017 Nov;92(5):1206-1216. doi: 10.1016/j.kint.2017.03.026. Epub 2017 May 20. Kidney Int. 2017. PMID: 28532709 Free PMC article.
-
Novel semi-automated kidney volume measurements in autosomal dominant polycystic kidney disease.Clin Exp Nephrol. 2018 Jun;22(3):583-590. doi: 10.1007/s10157-017-1486-6. Epub 2017 Nov 3. Clin Exp Nephrol. 2018. PMID: 29101551
References
-
- Wilson PD: Polycystic kidney disease. N Engl J Med 350: 151–164, 2004 - PubMed
-
- Chapman AB, Bost JE, Torres VE, Guay-Woodford L, Bae KT, Landsittel D, Li J, King BF, Martin D, Wetzel LH, Lockhart ME, Harris PC, Moxey-Mims M, Flessner M, Bennett WM, Grantham JJ: Kidney volume and functional outcomes in autosomal dominant polycystic kidney disease. Clin J Am Soc Nephrol 7: 479–486, 2012 - PMC - PubMed
-
- Chapman AB, Guay-Woodford LM, Grantham JJ, Torres VE, Bae KT, Baumgarten DA, Kenney PJ, King BF, Jr, Glockner JF, Wetzel LH, Brummer ME, O’Neill WC, Robbin ML, Bennett WM, Klahr S, Hirschman GH, Kimmel PL, Thompson PA, Miller JP, Consortium for Radiologic Imaging Studies of Polycystic Kidney Disease cohort : Renal structure in early autosomal-dominant polycystic kidney disease (ADPKD): The Consortium for Radiologic Imaging Studies of Polycystic Kidney Disease (CRISP) cohort. Kidney Int 64: 1035–1045, 2003 - PubMed
-
- Grantham JJ, Torres VE, Chapman AB, Guay-Woodford LM, Bae KT, King BF, Jr, Wetzel LH, Baumgarten DA, Kenney PJ, Harris PC, Klahr S, Bennett WM, Hirschman GN, Meyers CM, Zhang X, Zhu F, Miller JP, CRISP Investigators : Volume progression in polycystic kidney disease. N Engl J Med 354: 2122–2130, 2006 - PubMed
-
- Harris PC, Bae KT, Rossetti S, Torres VE, Grantham JJ, Chapman AB, Guay-Woodford LM, King BF, Wetzel LH, Baumgarten DA, Kenney PJ, Consugar M, Klahr S, Bennett WM, Meyers CM, Zhang QJ, Thompson PA, Zhu F, Miller JP: Cyst number but not the rate of cystic growth is associated with the mutated gene in autosomal dominant polycystic kidney disease. J Am Soc Nephrol 17: 3013–3019, 2006 - PubMed
Publication types
MeSH terms
Associated data
Grants and funding
- RR00585/RR/NCRR NIH HHS/United States
- UL1 RR024153/RR/NCRR NIH HHS/United States
- DK056956/DK/NIDDK NIH HHS/United States
- UL1 TR000165/TR/NCATS NIH HHS/United States
- DK056957/DK/NIDDK NIH HHS/United States
- UL1TR000005/TR/NCATS NIH HHS/United States
- U01 DK056943/DK/NIDDK NIH HHS/United States
- M01 RR000032/RR/NCRR NIH HHS/United States
- RR23940/RR/NCRR NIH HHS/United States
- RR025008/RR/NCRR NIH HHS/United States
- M01 RR000585/RR/NCRR NIH HHS/United States
- RR025777/RR/NCRR NIH HHS/United States
- UL1 TR000005/TR/NCATS NIH HHS/United States
- U01 DK056956/DK/NIDDK NIH HHS/United States
- UL1TR000165/TR/NCATS NIH HHS/United States
- RR033179/RR/NCRR NIH HHS/United States
- U01 DK056957/DK/NIDDK NIH HHS/United States
- M01 RR000039/RR/NCRR NIH HHS/United States
- UL1 RR033179/RR/NCRR NIH HHS/United States
- DK056961/DK/NIDDK NIH HHS/United States
- M01 RR023940/RR/NCRR NIH HHS/United States
- UL1 RR025777/RR/NCRR NIH HHS/United States
- RR000032/RR/NCRR NIH HHS/United States
- UL1 TR000454/TR/NCATS NIH HHS/United States
- U01 DK056961/DK/NIDDK NIH HHS/United States
- UL1 RR024150/RR/NCRR NIH HHS/United States
- RR000039/RR/NCRR NIH HHS/United States
- RR024150/RR/NCRR NIH HHS/United States
- DK056943/DK/NIDDK NIH HHS/United States
- RR024153/RR/NCRR NIH HHS/United States
- UL1 RR025008/RR/NCRR NIH HHS/United States
LinkOut - more resources
Full Text Sources
Other Literature Sources
Medical
