. 2013 Jul;62(7):2396-409.
doi: 10.2337/db12-1081. Epub 2013 Mar 21.

Identification of sucrose non-fermenting-related kinase (SNRK) as a suppressor of adipocyte inflammation

Affiliations

Identification of sucrose non-fermenting-related kinase (SNRK) as a suppressor of adipocyte inflammation

Yujie Li et al. Diabetes. 2013 Jul.

Abstract

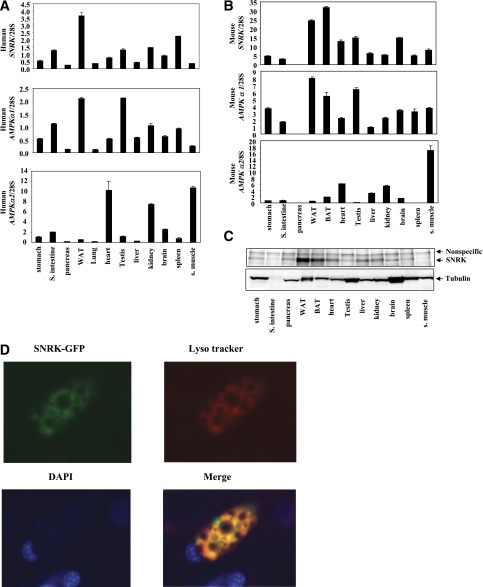
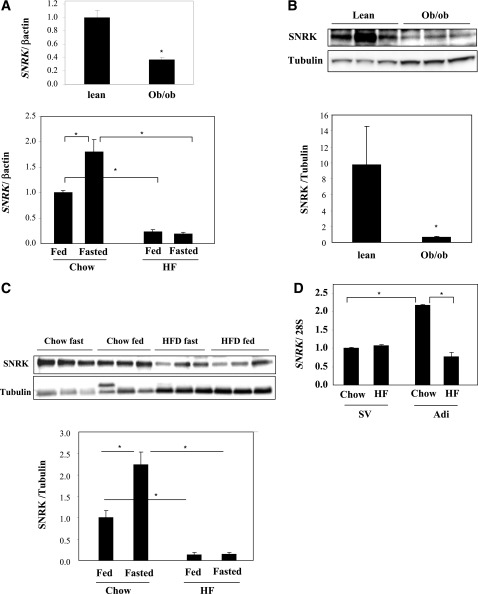
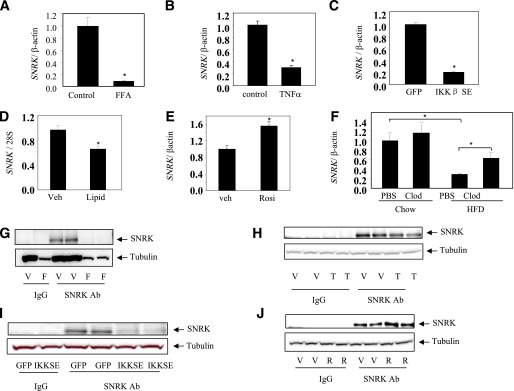
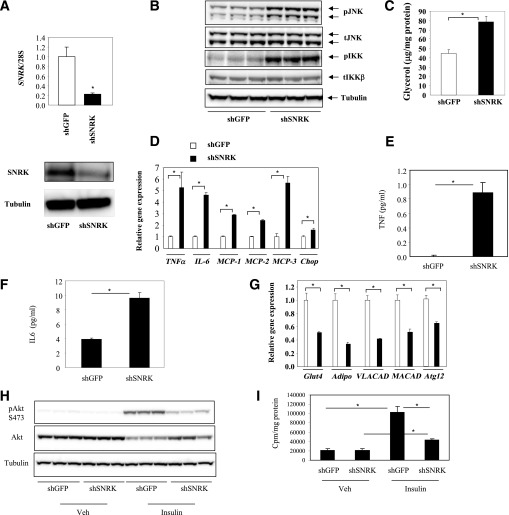
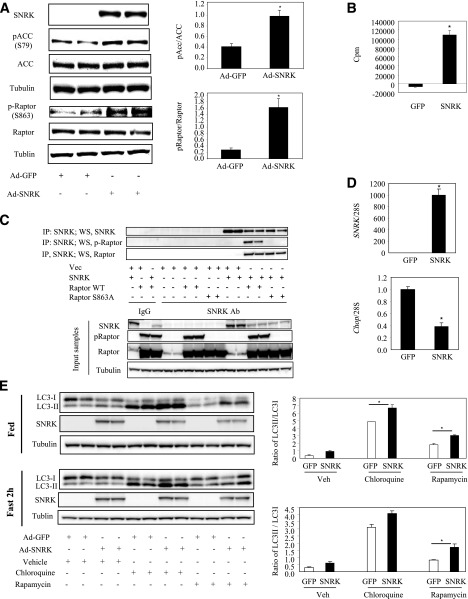
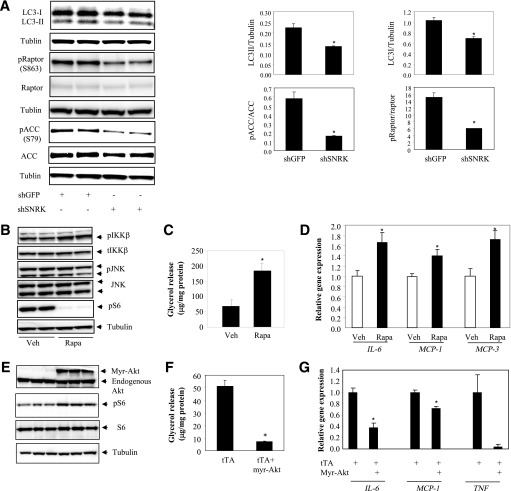
In this study, the role of sucrose non-fermenting-related kinase (SNRK) in white adipocyte biology was investigated. SNRK is abundantly expressed in adipose tissue, and the expression level is decreased in obese mice. SNRK expression is repressed by inflammatory signals but increased by insulin sensitizer in cultured adipocytes. In vivo, adipose tissue SNRK expression can be decreased by lipid injection but enhanced by macrophage ablation. Knocking down SNRK in cultured adipocytes activates both JNK and IKKβ pathways as well as promotes lipolysis. Insulin-stimulated Akt phosphorylation and glucose uptake are impaired in SNRK knockdown adipocytes. Phosphoproteomic analysis with SNRK knockdown adipocytes revealed significantly decreased phosphorylation of 49 proteins by 25% or more, which are involved in various aspects of adipocyte function with a clear indication of attenuated mTORC1 signaling. Phosphorylation of 43 proteins is significantly increased by onefold or higher, among which several proteins are known to be involved in inflammatory pathways. The inflammatory responses in SNRK knockdown adipocytes can be partially attributable to defective mTORC1 signaling, since rapamycin treatment activates IKKβ and induces lipolysis in adipocytes. In summary, SNRK may act as a suppressor of adipocyte inflammation and its presence is necessary for maintaining normal adipocyte function.


Figures

FIG. 1.
FIG. 1.
Tissue distribution of SNRK and AMPKα. A: Relative mRNA expression levels of SNRK, AMPKα1, and AMPKα2 in human tissues. RNA samples from pooled human tissues were purchased from Clonetech (stomach cat. no. 636126, small intestine 636125, pancreas 636119, white adipose tissue 636162, lung 636105, heart 636113, testis 636115, liver 636101, kidney 636118, brain 636102, spleen 636121, and skeletal muscle 636120). B: Relative mRNA expression levels of SNRK, AMPKα1, and AMPKα2 in mouse tissues. Tissues from four male C57BL/6 mice were pooled for RNA preparation. C: SNRK protein levels in mouse tissues. Tissues from four male C57BL/6 mice were pooled for protein preparation. SNRK was immunoprecipitated from 1 mg protein lysates. D: SNRK localization. The SNRK-GFP fusion protein was expressed in 3T3-L1 CAR adipocytes via adenovirus-mediated gene transfer. Forty-eight hours after infection, adipocytes were stained with Lyso tracker (10,000×, cat. no. L-7528; Invitrogen) (red) for presence of lysosomes and DAPI (final concentration at 1 μg/mL) (blue) for presence of nucleus during a 2-h incubation. The images were overlaid, and the orange color indicates overlapping of SNRK-GFP and Lyso tracker. BAT, brown adipose tissue; S., small; WAT, white adipose tissue.
FIG. 2.
FIG. 2.
Regulation of SNRK expression in adipose tissue. A: Regulation of SNRK gene expression in adipose tissue of ob/ob mice (top panel) (n = 5 per group) and high-fat diet DIO mice (bottom panel) (n = 4 per group). B: Regulation of SNRK protein expression in adipose tissue of ob/ob mice (n = 3 per group). C: Regulation of SNRK protein expression in adipose tissue of DIO mice (n = 4 per group). D: Regulation of SNRK gene expression in adipocytes and stromal vascular cells isolated from chow-fed and DIO mice (fat pads were pooled from 6–8 mice in each group). Adi, adipocytes; HF, high fat; SV, stromal vascular cells. *P < 0.05. Error bars stand for mean ± SE.
FIG. 3.
FIG. 3.
Effect of proinflammatory signals on SNRK expression. A: Effect of FFA on SNRK gene expression in cultured adipocytes. FFA mixture (cat. no. F7050; Sigma) was used at a final concentration of 0.25 μmol/L for 6 h. B: Effect of TNF-α on SNRK gene expression in cultured adipocytes. TNF-α was used at a final concentration of 25 ng/mL for 6 h. C: Effect of overexpressing the constitutively active IKKβ (IKKβ SE) on SNRK gene expression in L1-CAR adipocytes. D: Effect of intravenous lipid injection in lean mice on SNRK gene expression in isolated adipocytes. Epididymal fat pads were pooled from three mice in each group for adipocyte isolation 30 min after injection with liposyn II at 3 mL/kg/h. E: Effect of rosiglitazone (Rosi) treatment on SNRK gene expression in cultured adipocytes. Rosiglitazone was used at a final concentration of 10 μmol/L for 6 h. F: Effect of adipose tissue macrophage depletion on SNRK gene expression in lean and DIO mice (n = 4 in each group). Mice were 23 weeks old and on a high-fat diet for 19 weeks. Clodronate or PBS liposomes were injected into peritoneal cavity at the dose of 110 mg/kg. G: Effect of FFA on SNRK protein expression in cultured adipocytes. H: Effect of TNF-α on SNRK protein expression in cultured adipocytes. I: Effect of overexpressing IKKβ SE on SNRK protein expression in L1-CAR adipocytes. J: Effect of rosiglitazone treatment on SNRK protein expression in cultured adipocytes. *P < 0.05. For cell-based experiments, triplicate samples were used in gene expression and duplicate samples were used in protein expression. Results shown are representative from three independent experiments. Error bars stand for mean ± SE. Ab, antibody; Clod, clodronate liposomes; F, FFA; Lipid, liposyn II; PBS, PBS liposomes; R, rosiglitazone; T, TNF-α; V, vehicle; Veh, vehicle. (A high-quality color representation of this figure is available in the online issue.)
FIG. 4.
FIG. 4.
Effect of SNRK knockdown on adipocyte biology. A: SNRK knockdown by adenovirus-mediated shRNA on mRNA (top panel) and protein (bottom panel) levels. B: Effect of SNRK knockdown on phosphorylation of IKKβ and JNK. C: Effect of SNRK knockdown on lipolysis. D: Effect of SNRK knockdown on expression of TNF-α, IL-6, MCP-1, MCP-2, MCP-3, and chop genes. E: Effect of SNRK knockdown on TNF-α secretion. F: Effect of SNRK knockdown on IL-6 secretion. G: Effect of SNRK knockdown on expression of Glut4, Adipo, VLACAD, MACAD, and Atg12 genes. H: Effect of SNRK knockdown on insulin-stimulated Akt phosphorylation. I: Effect of SNRK knockdown on insulin-stimulated glucose uptake. *P < 0.05. Triplicate samples were used in each experiment. Results shown were representative from three independent experiments. Error bars stand for mean ± SE. S, Ser; Veh, vehicle.
FIG. 5.
FIG. 5.
SNRK overexpression in hepatoma cells. A: SNRK overexpression and phosphorylation on ACC and raptor. B: SNRK activity in hepatoma cells overexpressing GFP or mouse SNRK. For kinase assay, SNRK was immunoprecipitated (IP) and incubated with the reaction mixture (200 μmol/L AMARA peptide; 1 mmol/L ATP; 10 μci γ-32P-ATP; 10 mmol/L magnesium acetate; 50 mmol/L Tris.Cl, pH 7.5; 0.1 mmol/L EGTA; and 0.1% v/v 2-mercaptoethanol) for 30 min at 30°C in a shaking-water bath. Reactions were then loaded on p81 filters. Radioactivities were counted after four washes with 0.5% phosphoric acid and once with water. Background activities were determined using IgG immunoprecipitated samples and subtracted from SNRK antibody immunoprecipitated samples. C: SNRK and raptor coimmunoprecipitation in 293A cells. D: SNRK overexpression and chop gene expression. E: Effect of SNRK overexpression on autophagy. *P < 0.05, Ad-SNRK–infected hepatoma cells vs. Ad-GFP–infected hepatoma cells. Duplicate samples were used in Western blots, and triplicate samples were used in gene expression and kinase activity experiments. Results shown were representative from three independent experiments. Error bars stand for means ± SE. WS, Western blot; Vec, vector; Ab, antibody; S, Ser; WT, wild type.
FIG. 6.
FIG. 6.
mTOR pathway and adipocyte inflammation. A: SNRK knockdown in 3T3-L1 CAR adipocyte and the effect on raptor and ACC phosphorylation. B: Rapamycin activates IKKβ in 3T3-L1 adipocytes. C: Rapamycin induces lipolysis in 3T3-L1 adipocytes. D: Rapamycin increases expression of proinflammatory factors. *P < 0.05, shSNRK-infected adipocytes vs. shGFP-infected adipocytes or rapamycin (Rapa)-treated adipocytes vs. vehicle (Veh)-treated adipocytes. Duplicate samples were used in Western blots, and triplicate samples were used in gene expression and lipolysis experiments. E: Overexpression of the constitutively active Akt1 (myr-Akt) activates mTOR signaling. F: Overexpression of myr-Akt suppresses lipolysis. G: Overexpression of myr-Akt decreases expression of inflammatory genes. *P < 0.05, cells expressing tTA plus myr-Akt vs. cells expressing tTA alone. Error bars stand for mean ± SE. S, Ser.

Similar articles

Cited by

References

    1. Hotamisligil GS. Inflammation and metabolic disorders. Nature 2006;444:860–867 - PubMed
    1. Hotamisligil GS, Murray DL, Choy LN, Spiegelman BM. Tumor necrosis factor alpha inhibits signaling from the insulin receptor. Proc Natl Acad Sci USA 1994;91:4854–4858 - PMC - PubMed
    1. Rotter V, Nagaev I, Smith U. Interleukin-6 (IL-6) induces insulin resistance in 3T3-L1 adipocytes and is, like IL-8 and tumor necrosis factor-alpha, overexpressed in human fat cells from insulin-resistant subjects. J Biol Chem 2003;278:45777–45784 - PubMed
    1. Tack CJ, Stienstra R, Joosten LA, Netea MG. Inflammation links excess fat to insulin resistance: the role of the interleukin-1 family. Immunol Rev 2012;249:239–252 - PubMed
    1. Sartipy P, Loskutoff DJ. Monocyte chemoattractant protein 1 in obesity and insulin resistance. Proc Natl Acad Sci USA 2003;100:7265–7270 - PMC - PubMed

Publication types

MeSH terms