. 2013;8(3):e58367.
doi: 10.1371/journal.pone.0058367. Epub 2013 Mar 8.

Metabolic adaptation to chronic inhibition of mitochondrial protein synthesis in acute myeloid leukemia cells

Affiliations

Metabolic adaptation to chronic inhibition of mitochondrial protein synthesis in acute myeloid leukemia cells

Bozhena Jhas et al. PLoS One. 2013.

Abstract

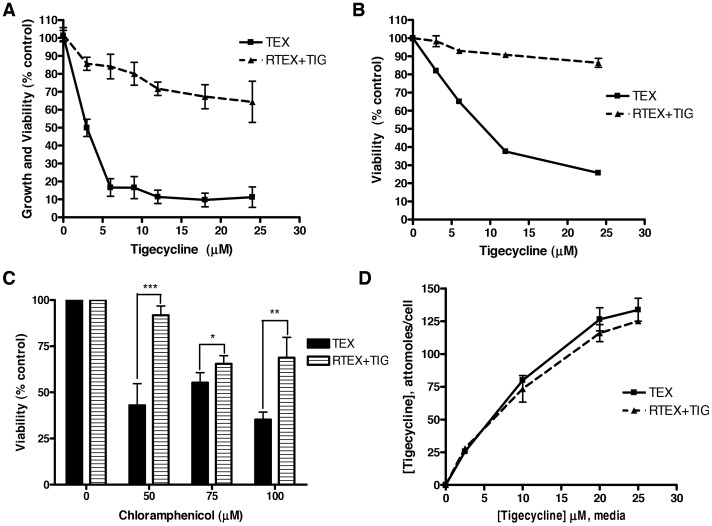
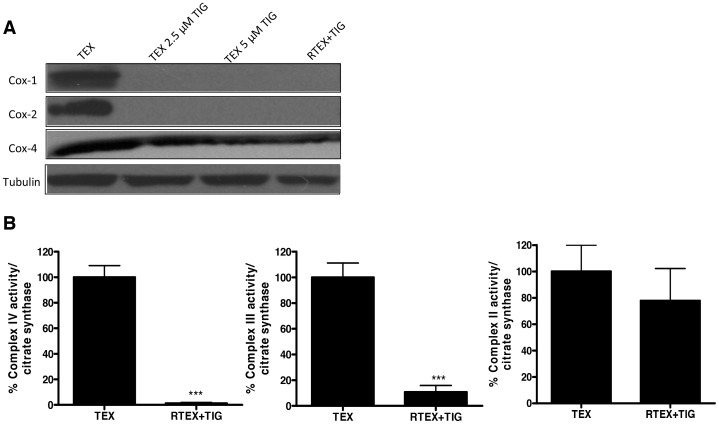
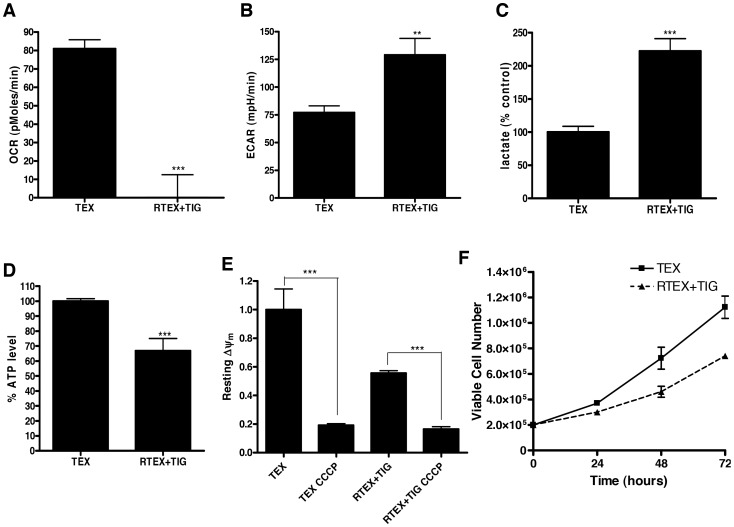
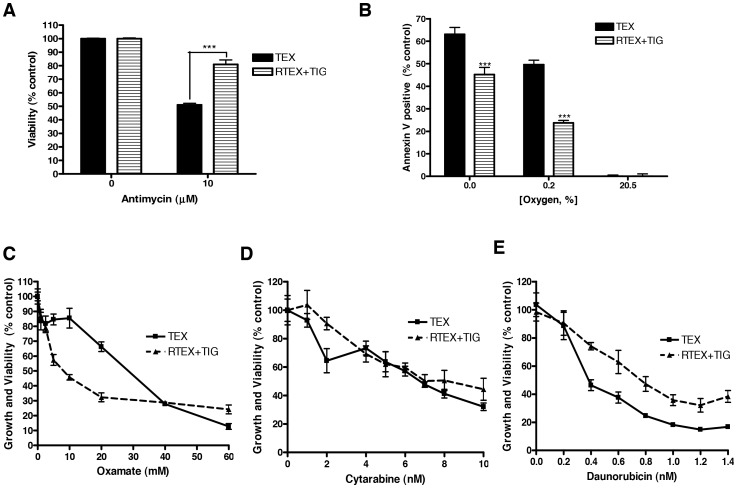
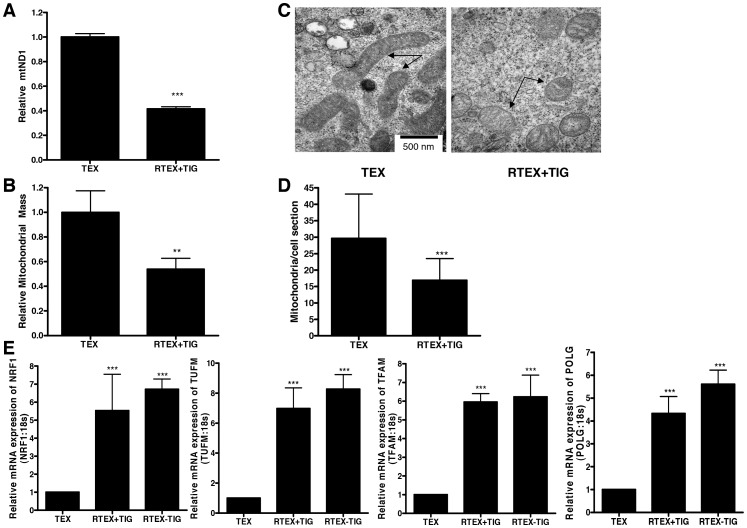
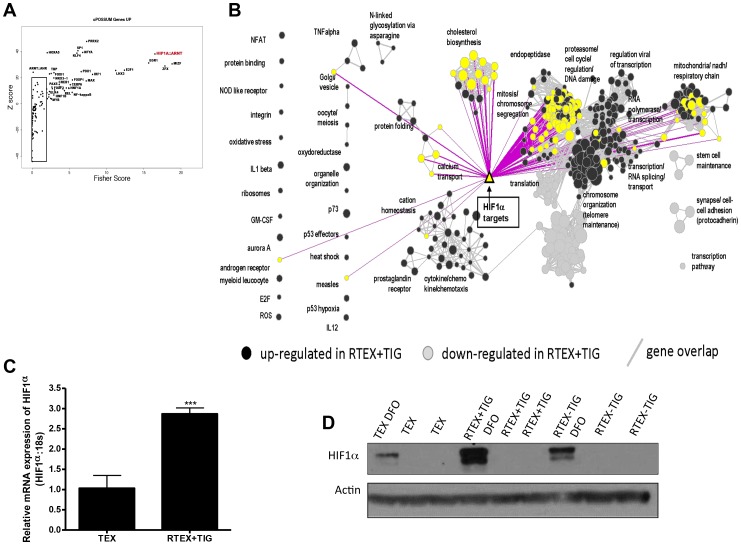
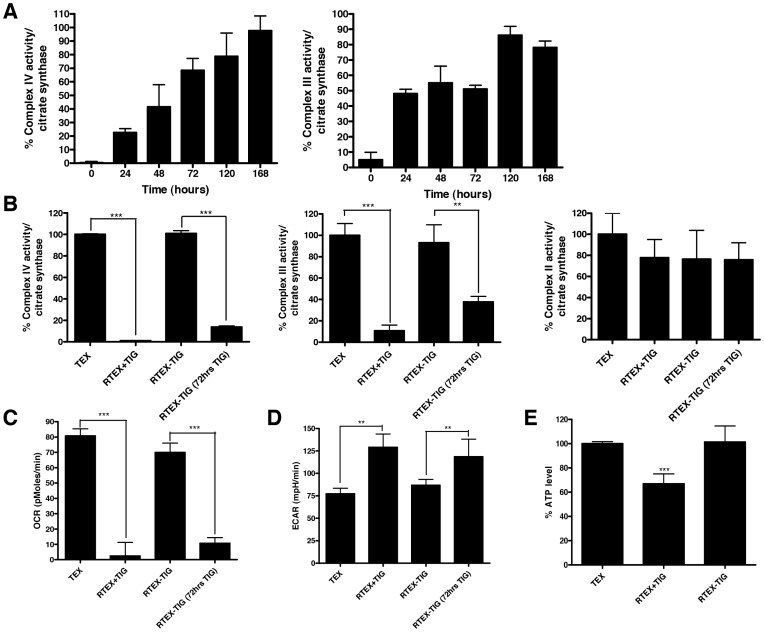
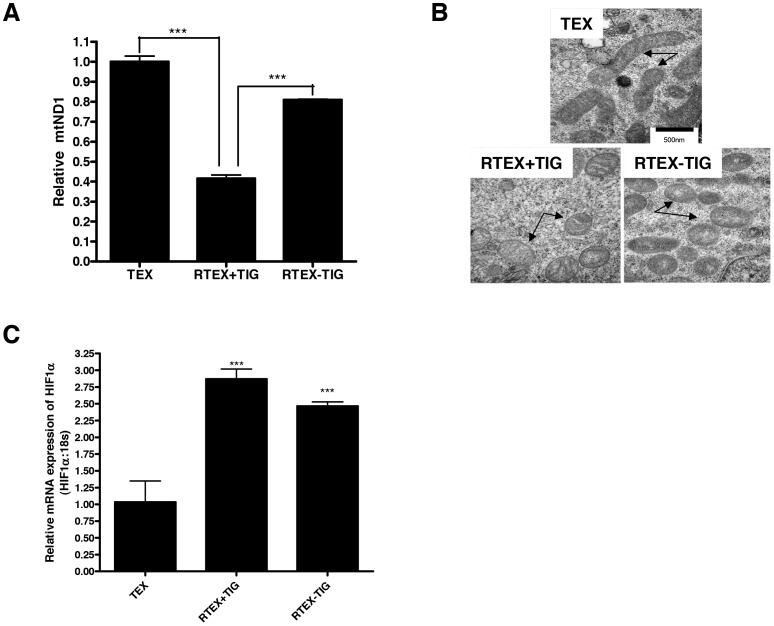
Recently, we demonstrated that the anti-bacterial agent tigecycline preferentially induces death in leukemia cells through the inhibition of mitochondrial protein synthesis. Here, we sought to understand mechanisms of resistance to tigecycline by establishing a leukemia cell line resistant to the drug. TEX leukemia cells were treated with increasing concentrations of tigecycline over 4 months and a population of cells resistant to tigecycline (RTEX+TIG) was selected. Compared to wild type cells, RTEX+TIG cells had undetectable levels of mitochondrially translated proteins Cox-1 and Cox-2, reduced oxygen consumption and increased rates of glycolysis. Moreover, RTEX+TIG cells were more sensitive to inhibitors of glycolysis and more resistant to hypoxia. By electron microscopy, RTEX+TIG cells had abnormally swollen mitochondria with irregular cristae structures. RNA sequencing demonstrated a significant over-representation of genes with binding sites for the HIF1α:HIF1β transcription factor complex in their promoters. Upregulation of HIF1α mRNA and protein in RTEX+TIG cells was confirmed by Q-RTPCR and immunoblotting. Strikingly, upon removal of tigecycline from RTEX+TIG cells, the cells re-established aerobic metabolism. Levels of Cox-1 and Cox-2, oxygen consumption, glycolysis, mitochondrial mass and mitochondrial membrane potential returned to wild type levels, but HIF1α remained elevated. However, upon re-treatment with tigecycline for 72 hours, the glycolytic phenotype was re-established. Thus, we have generated cells with a reversible metabolic phenotype by chronic treatment with an inhibitor of mitochondrial protein synthesis. These cells will provide insight into cellular adaptations used to cope with metabolic stress.


Conflict of interest statement

Competing Interests: The authors have declared that no competing interests exist.

Figures

Figure 1
Figure 1. Tigecycline-resistant cells established by sustained drug treatment.
TEX and RTEX+TIG cells were treated with increasing concentrations of tigecycline for 72 hours. A Cell growth and viability was measured by the sulforhodamine B assay. Data represent the mean ± SD percent from a representative experiment. B Cell viability was measured by Annexin V and PI staining and flow cytometry. Data represent the mean ± SD percent viable cells from a representative experiment. C TEX and RTEX+TIG cells were treated with increasing concentrations of chloramphenicol for 7 days. Cell viability was measured by trypan blue staining. Data represent the mean ± SD percent viable cells from three independent experiments. D Tigecycline was removed from the culture medium of RTEX+TIG cells for 3 hours. Then, RTEX+TIG and wild type TEX cells were treated with increasing concentrations of tigecycline for 6 hours. After treatment, cells were harvested and intracellular concentrations of tigecycline were determined by HPLC-UV. Data represent the mean ± SD intracellular concentration of tigecycline from a representative experiment.
Figure 2
Figure 2. RTEX+TIG cells have undetectable levels and activity of mitochondrial respiratory chain complexes.
Total proteins were extracted from untreated TEX and RTEX+TIG cells, as well as TEX cells treated with 2.5 µM and 5 µM tigecycline for 24 hours. A Levels of Cox-1, Cox-2, Cox-4 and tubulin were measured by immunoblotting. B Complex II, III and IV enzyme activity relative to citrate synthase activity was determined as described in the Materials and Methods section. Results shown as mean ± SD of three independent experiments.
Figure 3
Figure 3. RTEX+TIG cells have defective oxidative phosphorylation.
A Basal oxygen consumption rate of TEX and RTEX+TIG cells was measured with the Seahorse Metabolic Flux Analyzer as described in the Materials and Methods section. Results shown as mean ± SD of three independent experiments. B Basal extracellular acidification rate of TEX and RTEX+TIG cells was measured with the Seahorse Metabolic Flux Analyzer as described in the Materials and Methods section. Results shown as mean ± SD of three independent experiments. C Lactate production of TEX and RTEX+TIG cells (2×10⁷) was measured by NMR as described in the Materials and Methods section. Results shown as mean ± SD of independent experiments. D Intracellular ATP content of TEX and RTEX+TIG cells was measured as described in the Materials and Methods section. Results shown as mean ± SD from a representative experiment. E Resting mitochondrial membrane potential (Δψ, Red/Green ratio) was measured in TEX and RTEX+TIG cells before and after uncoupling the potential with CCCP. Cells were stained with JC-1 dye and analyzed by flow cytometry. Results shown as mean ± SD fluorescence intensity relative to TEX cells. F The number of viable TEX and RTEX+TIG cells was counted using trypan blue staining at 24, 48 and 72 hours. Results shown as mean ± SD viable cells from independent experiments.
Figure 4
Figure 4. RTEX+TIG cells are not dependent on oxidative phosphorylation.
A TEX and RTEX+TIG cells were treated with the complex III inhibitor, antimycin (10 µM) for 72 hours. After incubation, cell viability was measured by Annexin V and PI staining. Results are shown as the mean ± SD from a representative experiment. B TEX and RTEX+TIG cells were cultured in decreasing oxygen concentrations for 72 hours. After incubation, cell viability was measured by Annexin V and PI staining. Results are shown as the mean ± SD from independent experiments. C TEX and RTEX+TIG cells were treated with increasing concentrations of oxamate for 48 hours. After incubation, cell growth and viability were measured by the sulforhodamine B assay. Results are shown as the mean ± SD from a representative experiment. D TEX and RTEX+TIG cells were treated with increasing concentrations of cytarabine for 72 hours. After incubation, cell growth and viability were measured by the sulforhodamine B assay. Results are shown as the mean ± SD from a representative experiment. E TEX and RTEX+TIG cells were treated with increasing concentrations of daunorubicin for 72 hours. After incubation, cell growth and viability were measured by sulforhodamine B assay. Results are shown as the mean ± SD from a representative experiment.
Figure 5
Figure 5. RTEX+TIG cells have altered mitochondrial mass and structure.
A DNA was extracted from TEX and RTEX+TIG cells. Quantitative PCR was performed for mitochondrial ND1 relative to the human globulin gene (HGB). Results shown as mean ± SD ratio of ND1/HGB compared to TEX cells from a representative experiment done in triplicate. B Mitochondrial mass was measured in TEX and RTEX+TIG cells by incubating cells with mitotracker Green FM dye and subsequent flow cytometry. Results shown as mean ± SD relative fluorescence intensity compared to TEX cells. A representative experiment is shown. C Mitochondrial morphology (arrows) was assessed in TEX and RTEX+TIG cells using transmission electron microscopy as described in the Materials and Methods section. Representative images taken at 50,000× are shown. The scale bar is 500 nm. D Mitochondria number was quantified by transmission electron microscopy. Data represent the mean number of the mitochondria reported as the cross-sectional area of individual mitochondria ± SD. Number of sections examined equals 16 in TEX and 20 in RTEX+TIG cells. E Total cellular RNA was isolated from TEX, RTEX+TIG, and RTEX-TIG cells. NRF1, TFAM, TUFM and POLG expression was measured relative to 18S RNA by real-time RT-PCR. Data represent the mean±SD HIF1α/18S expression relative to TEX cells from independent experiments.
Figure 6
Figure 6. RTEX+TIG cells have increased expression of HIF1α.
A Plot of the Fisher score (x-axis) vs. the z-score (y-axis) from the oPOSSUM transcription factor enrichment analysis of the list of genes over-expressed 1.5-fold or greater in RTEX+TIG cells compared to TEX cells. Each transcription factor is represented by a point on the graph; transcription factors whose binding sites are most strongly enriched within the promoters of the specified gene list have high scores (top right of plot). B Enrichment map visualization of the pathway enrichment analysis performed on the RNA sequencing dataset, which also maps the list of HIF1α transcriptional targets (yellow triangle), using a p-value cut-off of 0.001 and FDR cut-off of 0.1. Each circle (node) represents a gene set (pathway). Dark grey nodes are pathways enriched for genes up-regulated and light grey nodes are pathways enriched for genes down-regulated in RTEX+TIG cells, compared with wild type TEX cells. Yellow nodes represent gene sets that contain HIF1α transcriptional targets. Pathways (nodes) are connected when they overlap (i.e. they have genes in common), with line width corresponding to the number of shared genes (grey lines). Pink lines illustrate the connections between identified nodes and the HIF1α transcriptional target set. Node size is proportional to the GSEA normalized enrichment score (NES). C Total cellular RNA was isolated from TEX and RTEX+TIG cells. HIF1α expression was measured relative to 18S RNA by real-time RT-PCR. Data represent the mean±SD HIF1α/18S expression relative to TEX cells. D TEX, RTEX+TIG, and RTEX-TIG cells were treated with 100 µM desferoxamine (DFO) for 4 hours. After incubation, cells were harvested, total proteins were extracted, and levels of HIF1α and actin were measured by immunoblotting.
Figure 7
Figure 7. The defective oxidative phosphorylation in RTEX+TIG is reversible.
Tigecycline was withdrawn from the culture media of RTEX+TIG cells for one week (RTEX-TIG). A Complex III and IV enzyme activity relative to citrate synthase activity was determined in RTEX+TIG cells upon the withdrawal of tigecycline (RTEX-TIG) at various time points as described in the Materials and Methods section. Results shown as mean ± SD of three independent experiments. B Cells were then re-treated with tigecycline (24 µM) for 72 hours (RTEX-TIG (72 hrs TIG)). Complex IV, III, and II activity was measured as described in the Materials and Methods section. Data represent the mean±SD from three independent experiments. C Cells were then re-treated with tigecycline (10 µM) for 72 hours (RTEX-TIG (72 hrs TIG)). Oxygen consumption rate was measured with the Seahorse Metabolic Flux Analyzer. Data represent the mean±SD from a representative experiment. D Cells were then re-treated with tigecycline (10 µM) for 72 hours (RTEX-TIG (72 hrs TIG)). Extracellular acidification rate was measured with the Seahorse Metabolic Flux Analyzer. Data represent the mean±SD from a representative experiments. E Intracellular ATP content was measured in TEX, RTEX+TIG and RTEX-TIG cells. Data represent the mean±SD relative to TEX cells from a representative experiments.
Figure 8
Figure 8. Changes in mitochondrial morphology and HIF1α expression in RTEX-TIG cells are irreversible. A
DNA was extracted from TEX, RTEX+TIG cells, and RTEX-TIG cells. Quantitative PCR was performed for mitochondrial ND1 relative to the human globulin gene (HGB). Results shown as mean ± SD ratio of ND1/HGB compared to TEX cells from a representative experiment done in triplicate. B Mitochondrial morphology (arrows) was assessed in TEX, RTEX+TIG and RTEX-TIG cells using transmission electron microscopy as described in the Materials and Methods section. Representative images taken at 50,000× are shown. The scale bar is 500 nm. C Total cellular RNA was isolated and HIF1α expression was measured relative to 18S RNA by real-time RT-PCR. Data represent the mean±SD HIF1α/18S expression relative to TEX cells.

References

    1. Anderson S, Bankier AT, Barrell BG, de Bruijn MH, Coulson AR, et al. (1981) Sequence and organization of the human mitochondrial genome. Nature 290: 457–465. - PubMed
    1. King MP, Attardi G (1989) Human cells lacking mtDNA: repopulation with exogenous mitochondria by complementation. Science 246: 500–503. - PubMed
    1. Inoue K, Takai D, Hosaka H, Ito S, Shitara H, et al. (1997) Isolation and characterization of mitochondrial DNA-less lines from various mammalian cell lines by application of an anticancer drug, ditercalinium. Biochem Biophys Res Commun 239: 257–260. - PubMed
    1. Skrtic M, Sriskanthadevan S, Jhas B, Gebbia M, Wang X, et al. (2011) Inhibition of mitochondrial translation as a therapeutic strategy for human acute myeloid leukemia. Cancer Cell 20: 674–688. - PMC - PubMed
    1. Warner JK, Wang JC, Takenaka K, Doulatov S, McKenzie JL, et al. (2005) Direct evidence for cooperating genetic events in the leukemic transformation of normal human hematopoietic cells. Leukemia 19: 1794–1805. - PubMed

Publication types

MeSH terms