

Comparison and relative utility of inequality measurements: as applied to Scotland's child dental health
- PMID: 23520524
- PMCID: PMC3592808
- DOI: 10.1371/journal.pone.0058593
Comparison and relative utility of inequality measurements: as applied to Scotland's child dental health
Abstract
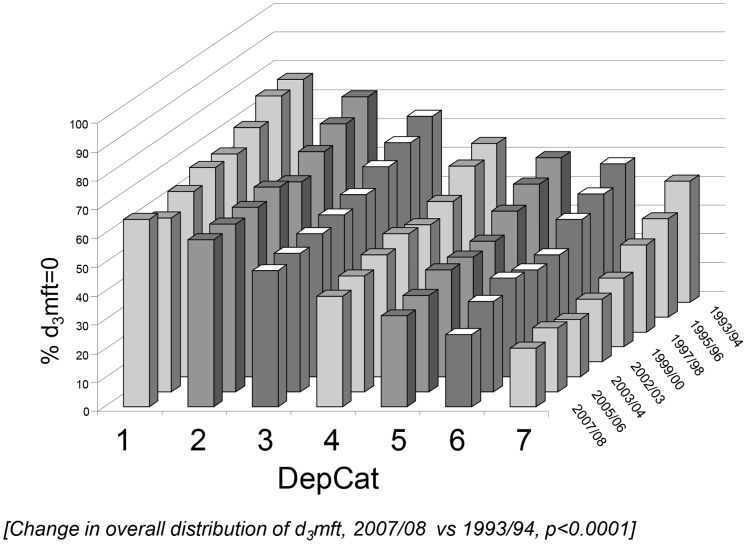
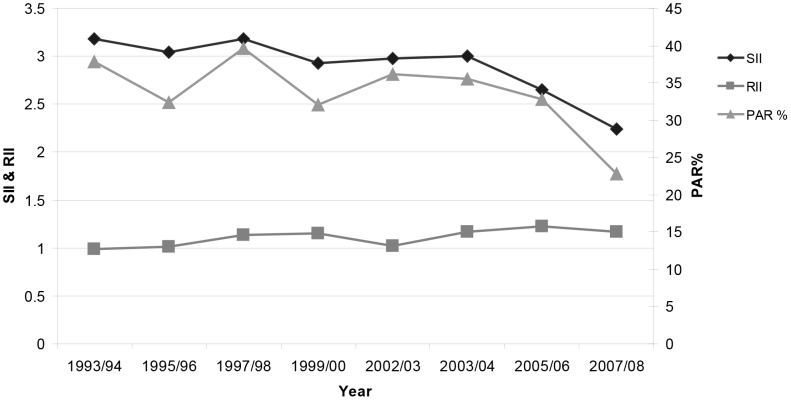
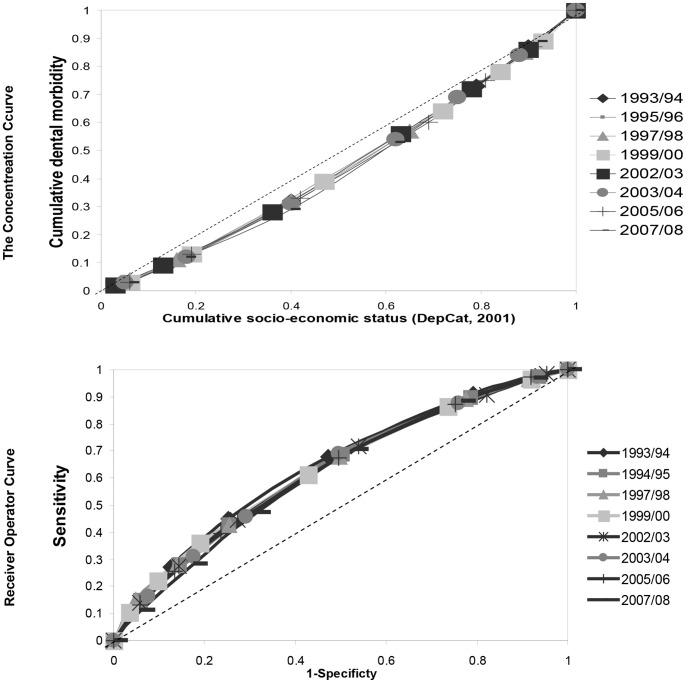
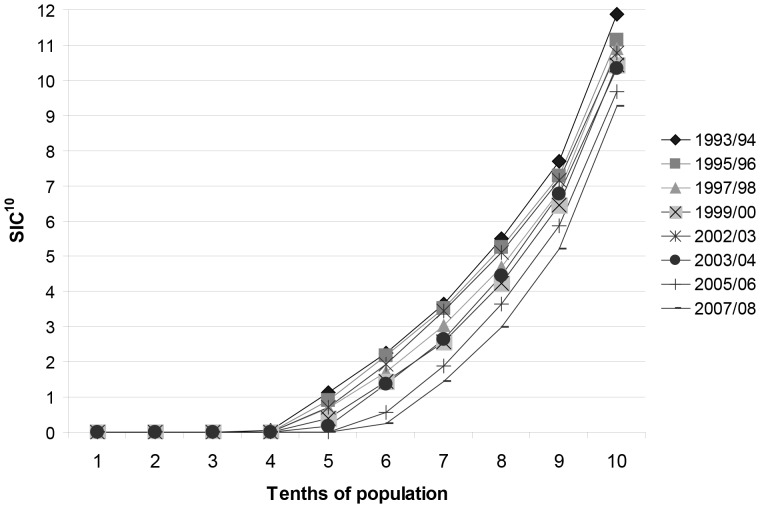
This study compared and assessed the utility of tests of inequality on a series of very large population caries datasets. National cross-sectional caries datasets for Scotland's 5-year-olds in 1993/94 (n = 5,078); 1995/96 (n = 6,240); 1997/98 (n = 6,584); 1999/00 (n = 6,781); 2002/03 (n = 9,747); 2003/04 (n = 10,956); 2005/06 (n = 10,945) and 2007/08 (n = 12,067) were obtained. Outcomes were based on the d3mft metric (i.e. the number of decayed, missing and filled teeth). An area-based deprivation category (DepCat) measured the subjects' socioeconomic status (SES). Simple absolute and relative inequality, Odds Ratios and the Significant Caries Index (SIC) as advocated by the World Health Organization were calculated. The measures of complex inequality applied to data were: the Slope Index of Inequality (absolute) and a variety of relative inequality tests i.e. Gini coefficient; Relative Index of Inequality; concentration curve; Koolman & Doorslaer's transformed Concentration Index; Receiver Operator Curve and Population Attributable Risk (PAR). Additional tests used were plots of SIC deciles (SIC(10)) and a Scottish Caries Inequality Metric (SCIM(10)). Over the period, mean d3mft improved from 3.1(95%CI 3.0-3.2) to 1.9(95%CI 1.8-1.9) and d3mft = 0% from 41.1(95%CI 39.8-42.3) to 58.3(95%CI 57.8-59.7). Absolute simple and complex inequality decreased. Relative simple and complex inequality remained comparatively stable. Our results support the use of the SII and RII to measure complex absolute and relative SES inequalities alongside additional tests of complex relative inequality such as PAR and Koolman and Doorslaer's transformed CI. The latter two have clear interpretations which may influence policy makers. Specialised dental metrics (i.e. SIC, SIC(10) and SCIM(10)) permit the exploration of other important inequalities not determined by SES, and could be applied to many other types of disease where ranking of morbidity is possible e.g. obesity. More generally, the approaches described may be applied to study patterns of health inequality affecting worldwide populations.
Conflict of interest statement
Figures
References
-
- Marmot M (2008) Closing the gap in a generation: Health equity through action on the social determinants of health. Geneva: World Health Organization. Available: http://www.who.int/social_determinants/thecommission/finalreport/en/inde.... Accessed 16 November 2009.
-
- Marmot M, Atkinson T, Bell J, Black C, Broadfoot P, et al... (2010) Fair Society, Healthy Lives. The Marmot Review. Strategic Review of Health Inequality in England post-2010. London: The Marmot Review.
-
- Acheson D (1998) Independent Inquiry into Inequalities in Health Report. London: The Stationery Office. ISBN 0 11 322173 8. Available: http://www.archive.official-documents.co.uk/document/doh/ih/ih.htm. Accessed 26 January 2007.
-
- The Scottish Government (2008) Equally Well, Report of the Ministerial Task Force on Health Inequalities, Volume 2. Edinburgh: The Scottish Government. Available: http://www.scotland.gov.uk/Resource/Doc/226607/0061266.pdf. Accessed 27 January 2011.
Publication types
MeSH terms
LinkOut - more resources
Full Text Sources
Other Literature Sources
Medical
