. 2013;8(3):e58935.
doi: 10.1371/journal.pone.0058935. Epub 2013 Mar 8.

Gli1 deletion prevents Helicobacter-induced gastric metaplasia and expansion of myeloid cell subsets

Affiliations

Gli1 deletion prevents Helicobacter-induced gastric metaplasia and expansion of myeloid cell subsets

Mohamad El-Zaatari et al. PLoS One. 2013.

Abstract

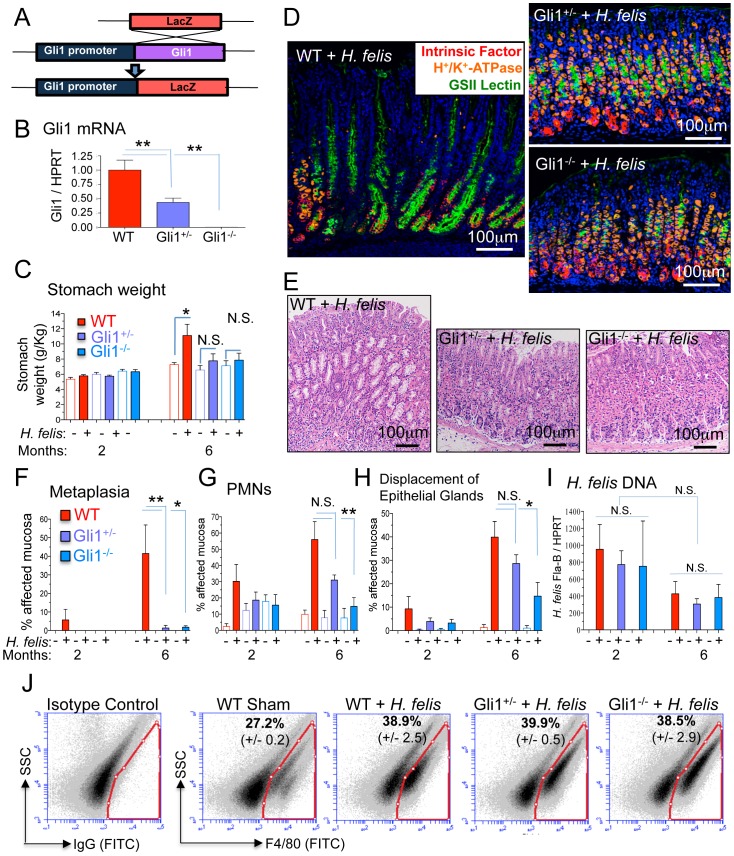
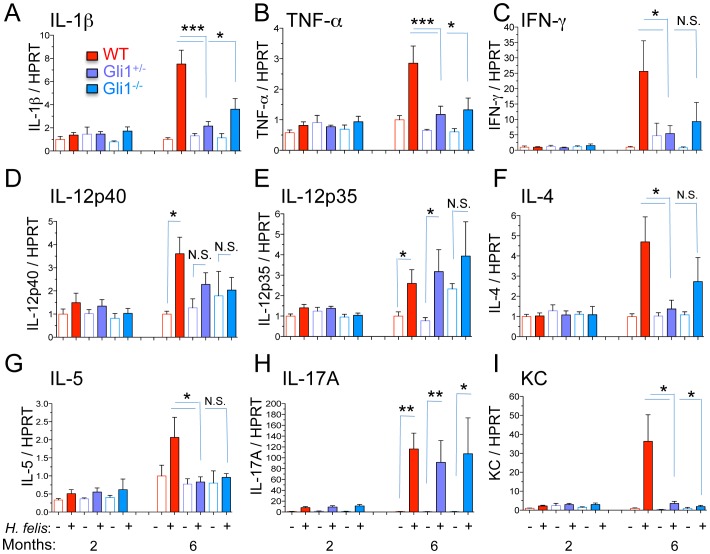
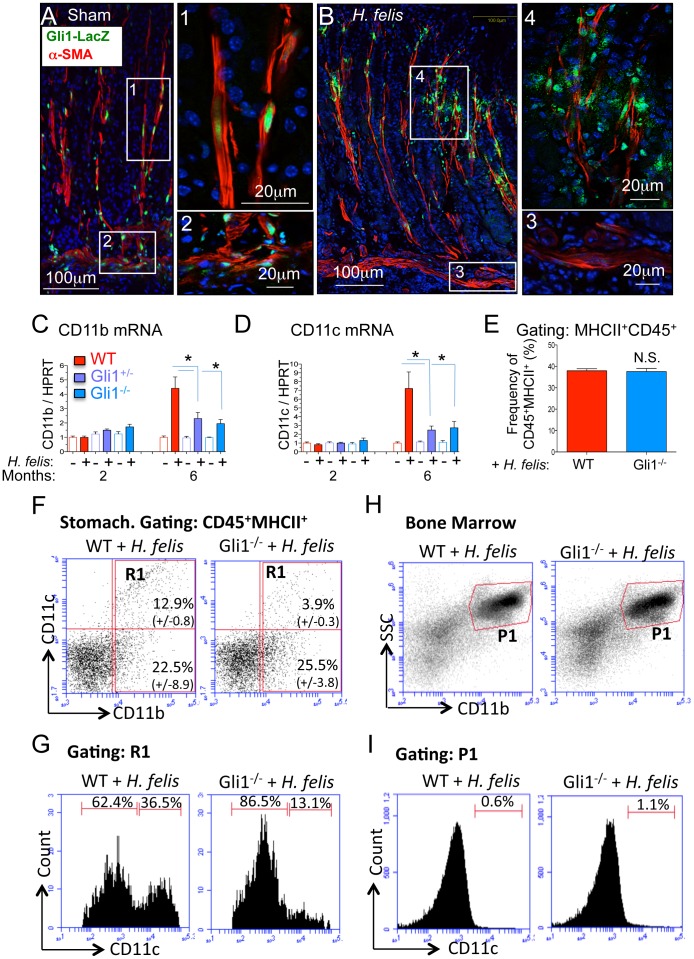
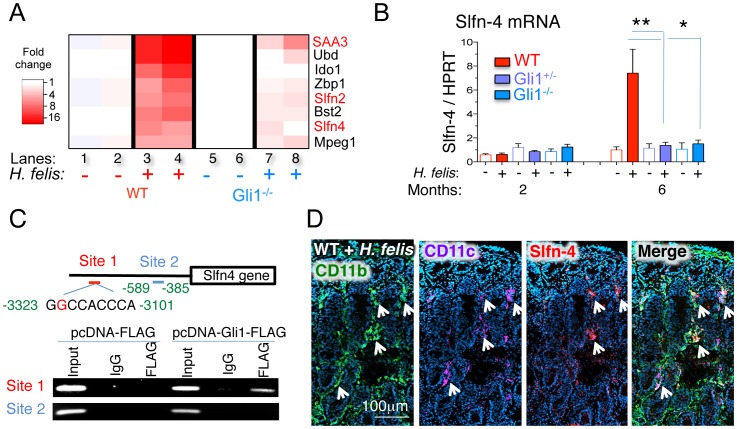
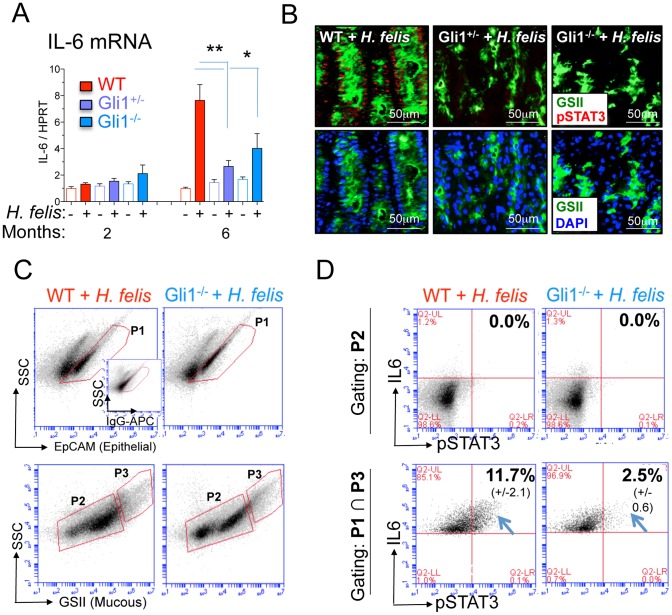
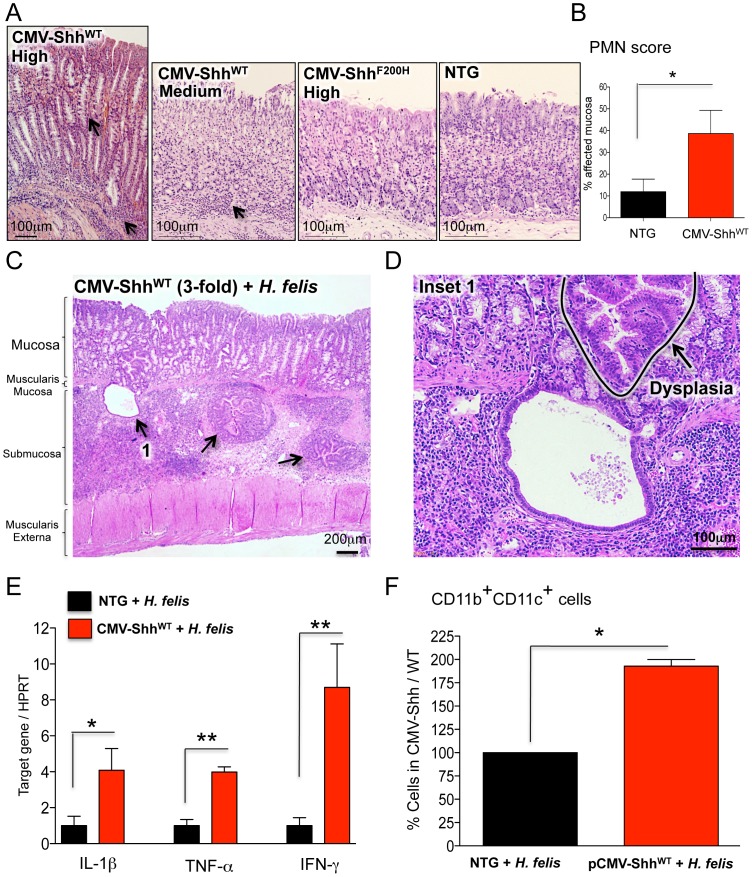
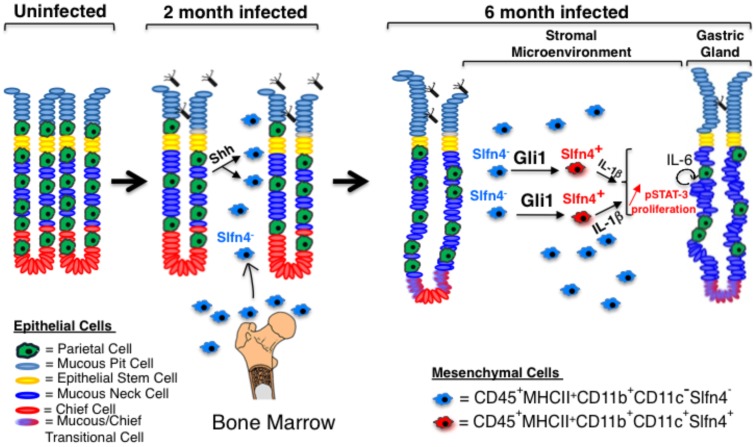
Chronic inflammation in the stomach induces metaplasia, the pre-cancerous lesion that precedes inflammation-driven neoplastic transformation. While Hedgehog signaling contributes to the initiation of some cancers, its role in gastric transformation remains poorly defined. We found that Helicobacter-infected C57BL/6 mice develop extensive mucous cell metaplasia at 6 month but not at 2 months post-infection. Gastric metaplasia coincided with the appearance of CD45(+)MHCII(+)CD11b(+)CD11c(+) myeloid cells that were normally not present in the chronic gastritis at 2 months. The myeloid regulatory gene Schlafen-4 was identified in a microarray analysis comparing infected WT versus Gli1 null mice and was expressed in the CD11b(+)CD11c(+) myeloid population. Moreover this same population expressed IL-1β and TNFα pro-inflammatory cytokines. By 6 months, the mucous neck cell metaplasia (SPEM) expressed IL-6, phosphorylated STAT3 and the proliferative marker Ki67. Expression was not observed in Gli1 mutant mice consistent with the requirement of Gli1 to induce this pre-neoplastic phenotype. Ectopic Shh ligand expression alone was not sufficient to induce SPEM, but with Helicobacter infection synergistically increased the histologic severity observed with the inflammation. Therefore Hedgehog signaling is required, but is not sufficient to generate pre-neoplastic changes during chronic gastritis. Gli1-dependent myeloid cell differentiation plays a pivotal role in the appearance of myeloid cell subtypes ostensibly required for SPEM development. Moreover, it suggests that therapies capable of targeting this phenotypic switch might prevent progression to metaplasia, the pre-neoplastic change that develops prior to dysplasia and gastric cancer, which also occurs in other epithelial-derived neoplasias initiated by chronic inflammation.


Conflict of interest statement

Competing Interests: The authors have declared that no competing interests exist.

Figures

Figure 1
Figure 1. Gli1 deletion prevents gastric metaplasia.
A) Schematic representation of LacZ substitution for the Gli1 gene to generate Gli1+/− and Gli1−/− mice. B) Gli1 mRNA in stomachs of WT, Gli1+/− and Gli1−/− mice. C) Stomach weight normalized to total body weight in infected and uninfected mice. D) Triple immunofluorescent staining of Griffonia simplicifolia II (GSII) lectin (green; mucous neck cells), intrinsic factor (red; chief cells), and H+/K+-ATPase (orange; parietal cells) in 6-month H. felis-infected WT, Gli1+/− and Gli1−/− stomachs. E) Hematoxylin and eosin (H&E) staining of the gastric mucosa in 6-month H. felis-infected WT, Gli1+/− and Gli1−/−. F–H) Histologic scoring of metaplasia, PMN infiltration, and displacement of epithelial glands by infiltrating inflammatory cells in 2- and 6-month H. felis-infected WT, Gli1+/− and Gli1−/− stomachs. I) qPCR quantification of H. felis flagellar filament B (Fla-B) DNA in the infected mucosa. J) Flow cytometric analysis of F4/80+ cells versus side-scatter in WT Sham and 6-month infected WT, Gli1+/− and Gli1−/− stomachs (N = 3 mice per group). Open and closed bars denote uninfected and infected mice respectively. For RT-qPCR experiments, N = 5–10 mice per group. Error bars represent the mean +/− SEM. ***p<0.001; **p<0.01; *p<0.05. N.S.  =  not significant.
Figure 2
Figure 2. Gli1 deletion blocks increase in Th1 and Th2 cytokines.
A–E) RT-qPCR determination of mRNA for Th1-associated cytokines. F–G) RT-qPCR of mRNA for Th2-associated cytokines. H) RT-qPCR of mRNA for the Th17-associated cytokine IL-17A. I) RT-qPCR analysis of the mRNA for the mouse IL-8 ortholog, chemokine KC. Open and closed bars denote uninfected and infected mice respectively. N = 5–10 mice per group. Error bars represent the mean +/− SEM. **p<0.01; *p<0.05.
Figure 3
Figure 3. Gli1 deletion prevents expansion of CD11b+CD11c+ myeloid cell subsets.
A–B) Immunofluorescent detection of β-gal (green), α-SMA (red), and DAPI (blue) in sham- and H. felis-infected Gli1+/LacZ mice. C–D) RT-qPCR analysis of CD11b and CD11c in 2- and 6-month infected mice. E) Bar graphs representing the percentages of CD45+MHCII+ myeloid cells per total gastric cell number in 6-month H. felis-infected WT versus Gli1−/− mice. F) Flow cytometric analysis of CD11b and CD11c in 6-month infected WT and Gli1−/− mice. Values on dot plot represent the percentages of cells (relative to total CD45+MHCII+ myeloid cell population) +/− SEM from N = 3 mice per group. G) Flow cytometry of CD11c+ cells within the CD11b+ stomach population (R1 gate from Figure 3F) of 6-month H. felis-infected WT versus Gli1−/− mice. H) Flow cytometric analysis of CD11b+ bone marrow cells in 6-month H. felis-infected WT and Gli1−/− mice. I) Flow cytometry of CD11c+ cells within the CD11b+ bone marrow population (P1 gate from Figure 3H) of 6-month H. felis-infected WT and Gli1−/− mice. Open and closed bars denote uninfected and infected mice respectively. Error bars represent the mean +/− SEM. For RT-qPCR graphs, N = 5–10 mice per group. For flow sorting bar graph, N = 3 mice per group. Values on flow cytometric dot blots represent the mean +/− SEM from 3 mice per group. *p<0.05.
Figure 4
Figure 4. Schlafen-4 is a Gli1-target gene that marks the CD11b+CD11c+ gastric myeloid population.
A) Microarray heat map of sham- and H. felis-infected WT and Gli1−/− stomachs. Each column represents pooled stomach RNA samples from two mice. B) RT-qPCR analysis of Slfn-4 mRNA from sham- or 6 month H. felis-infected WT, Gli1+/−, or Gli1−/− stomachs. C) ChIP analysis of two Slfn-4 promoter sequences in mouse Gli1 promoter in RAW264.7 cells transfected with Gli1-FLAG-overexpressing or the empty vector plasmid. D) Immunofluorescence analysis of CD11b (green), CD11c (magenta), Slfn-4 (red) in 6-month H. felis infected WT mice. Error bars represent the mean +/− SEM. N = 5–10 mice per group. **p<0.01; *p<0.05.
Figure 5
Figure 5. Gli1 deletion prevents IL-6 and pSTAT3 expression in SPEM.
A) RT-qPCR analysis of IL-6 mRNA. Error bars represent the mean +/− SEM. N = 5–10 mice per group. Open and closed bars denote uninfected and infected mice respectively. B) Immunofluorescent analysis of pSTAT3 (red), GSII (green) and DAPI (blue) in stomachs of 6-month infected mice. C) Flow cytometric gating for EpCAM+ (epithelial cells) and GSII+ (mucous neck cells, SPEM) in 6-month infected WT and Gli1−/− mice. The inset shows the rat IgG-APC isotype control for the EpCAM-APC antibody. D) IL-6 and pSTAT3 expression in GSII (non-mucous, gate P2), and EpCAM+GSII+ (mucous neck epithelial cells, gate P1 ∩ P3) in 6-month infected WT and Gli1−/− mice. Values on flow cytometric dot blots represent the mean +/− SEM from 3 mice per group. **p<0.01; *p<0.05.
Figure 6
Figure 6. Shh overexpression exacerbates Helicobacter gastritis.
A) H&E staining of NTG, CMV-ShhWT and CMV-ShhF200H mouse stomachs. Arrows indicate regions of inflammatory cell infiltration and mucous neck cell expansion, SPEM. B) Polymorphonuclear (PMN) cell scoring in NTG and CMV-ShhWT mice. C) H&E staining of 6-month infected CMV-ShhWT stomach. D) High power H&E staining of herniated epithelial glands in the gastric submucosa in 6-month infected CMV-ShhWT stomach. A dysplastic area is indicated. E) RT-qPCR analysis of IL-1β, TNF-α and IFN-γ in 6 month-infected CMV-ShhWT versus NTG stomachs. F) Bar graphs representing flow cytometric analysis of CD11b+CD11c+ cells in 6-month infected NTG and CMV-ShhWT stomachs. Positive cell numbers in infected CMV-ShhWT mice are expressed as a percentage of cells present in infected NTG controls (set to a 100%). Error bars represent the mean +/− SEM. N = 3 mice per group. **p<0.01; *p<0.05.
Figure 7
Figure 7. Proposed role of Hedgehog-dependent myeloid cells in Helicobacter-induced gastric metaplasia.
Upon Helicobacter infection, CD11b+CD11cSlfn-4 myeloid cells migrate from the bone marrow to the stomach in response to Shh ligand secretion from parietal cells. Prolonged exposure of these cells to the inflamed gastric environment induced by H. felis (∼6 months) induces a phenotypic shift into CD11b+CD11c+ myeloid cells, which express the marker Slfn-4. Gli1 expression in myeloid cells is necessary for this shift. Myeloid cell-derived IL-1β triggers the IL-6/pSTAT-3 pathway in epithelial mucous cells leading to mucous neck cell proliferation at the expense of parietal and chief cells (gland atrophy) and metaplasia (SPEM).

References

    1. Correa P, Haenszel W, Cuello C, Tannenbaum S, Archer M (1975) A model for gastric cancer epidemiology. Lancet 2: 58–60. - PubMed
    1. Goldenring JR, Nam KT, Mills JC (2011) The origin of pre-neoplastic metaplasia in the stomach: chief cells emerge from the Mist. Experimental cell research 317: 2759–2764. - PMC - PubMed
    1. Schmidt PH, Lee JR, Joshi V, Playford RJ, Poulsom R, et al. (1999) Identification of a metaplastic cell lineage associated with human gastric adenocarcinoma. Laboratory investigation; a journal of technical methods and pathology 79: 639–646. - PubMed
    1. Houghton J, Stoicov C, Nomura S, Rogers AB, Carlson J, et al. (2004) Gastric cancer originating from bone marrow-derived cells. Science 306: 1568–1571. - PubMed
    1. Tu S, Bhagat G, Cui G, Takaishi S, Kurt-Jones EA, et al. (2008) Overexpression of interleukin-1beta induces gastric inflammation and cancer and mobilizes myeloid-derived suppressor cells in mice. Cancer Cell 14: 408–419. - PMC - PubMed

Publication types

MeSH terms