

Changes in metabolic profiles after the Great East Japan Earthquake: a retrospective observational study
- PMID: 23521922
- PMCID: PMC3614525
- DOI: 10.1186/1471-2458-13-267
Changes in metabolic profiles after the Great East Japan Earthquake: a retrospective observational study
Abstract
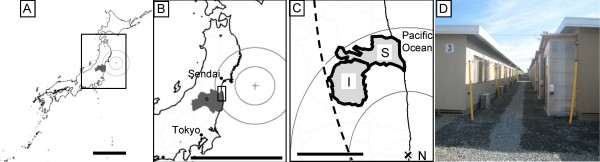
Background: A magnitude 9.0 earthquake struck off eastern Japan in March 2011. Many survivors have been living in temporary houses provided by the local government since they lost their houses as a result of the great tsunami (tsunami group) or the expected high-dose radiation resulting from the nuclear accident at the Fukushima Daiichi Nuclear Power Plant (radiation group). The tsunami was more than 9 m high in Soma, Fukushima, which is located 30 km north of the Fukushima Daiichi Nuclear Power Plant and adjacent to the mandatory evacuation area. A health screening program was held for the evacuees in Soma in September 2011. The aim of this study was to compare the metabolic profiles of the evacuees before and after the disaster. We hypothesized that the evacuees would experience deteriorated metabolic status based on previous reports of natural disasters.
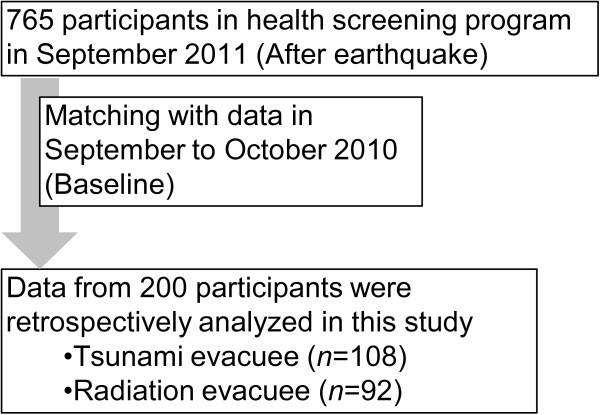
Methods: Data on 200 subjects who attended a health screening program in September or October of 2010 (pre-quake) and 2011 (post-quake) were retrospectively reviewed and included in this study. Pre-quake and post-quake results of physical examinations and laboratory tests were compared in the tsunami and radiation groups. A multivariate regression model was used to determine pre-quake predictive factors for elevation of hemoglobin A1c (HbA1c) in the tsunami group.
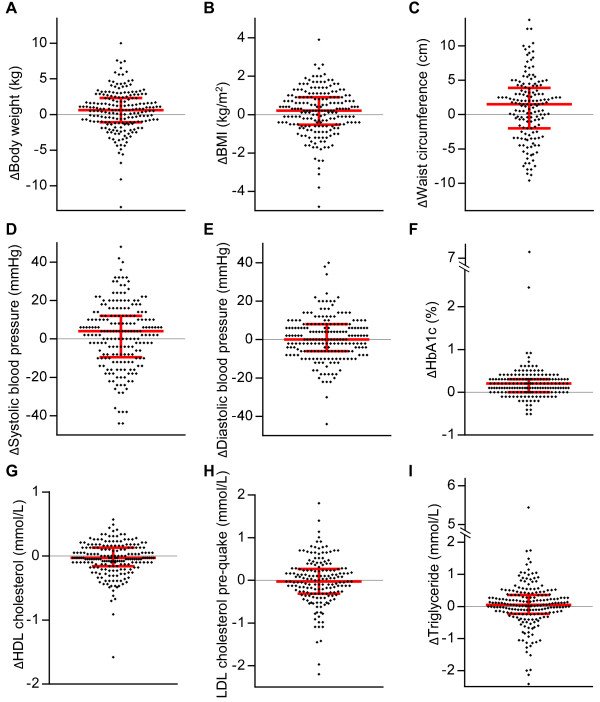
Results: Significantly higher values of body weight, body mass index, waist circumference, and HbA1c and lower high-density lipoprotein cholesterol levels were found at the post-quake screening when compared with the pre-quake levels (p = 0.004, p = 0.03, p = 0.008, p < 0.001, and p = 0.03, respectively). A significantly higher proportion of subjects in the tsunami group with high HbA1c, defined as ≥ 5.7%, was observed after the quake (34.3%) than before the quake (14.8%) (p < 0.001). Regional factors, periodic clinic visits, and waist circumference before the quake were identified as predictive factors on multivariate analysis for the deterioration of HbA1c.
Conclusions: Post-quake metabolic variables were impaired compared with pre-quake baseline levels in survivors who were living in temporary houses. A natural disaster could affect metabolic profiles, and careful follow-up for survivors should be planned.
Figures
References
-
- Damage situation and police countermeasures associated with 2011 Tohoku district - off the Pacific Ocean Earthquake. [ http://www.npa.go.jp/archive/keibi/biki/higaijokyo_e.pdf]
-
- The low-level nuclear threat. Nature. 2012;482(7383):5. 10.1038/483123a. - PubMed
Publication types
MeSH terms
Substances
LinkOut - more resources
Full Text Sources
Other Literature Sources
Medical
