. 2013 Mar 20;77(6):1174-86.
doi: 10.1016/j.neuron.2013.01.008.

Dopaminergic reward signals selectively decrease fMRI activity in primate visual cortex

Affiliations

Dopaminergic reward signals selectively decrease fMRI activity in primate visual cortex

John T Arsenault et al. Neuron. .

Abstract

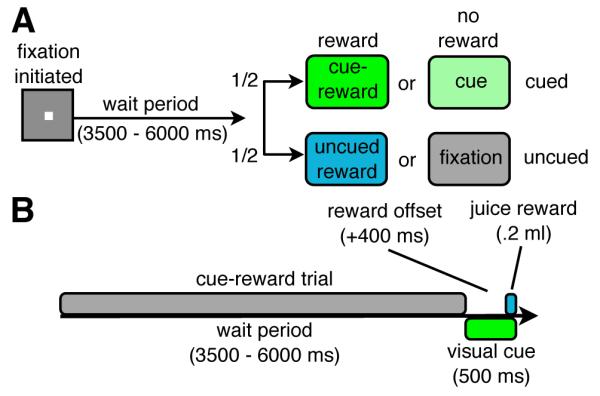
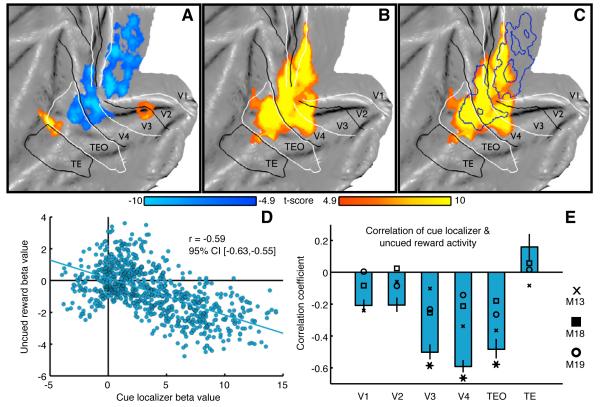
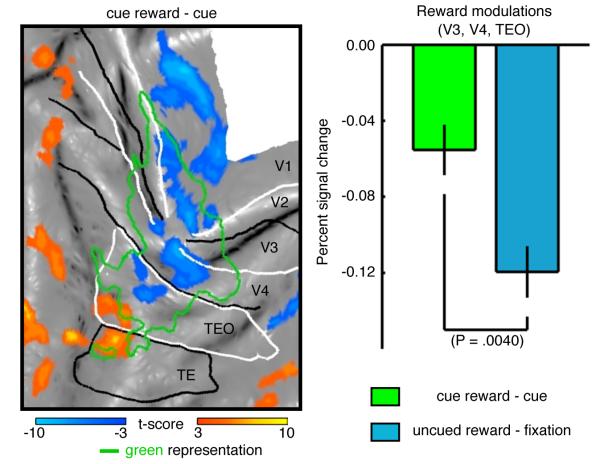
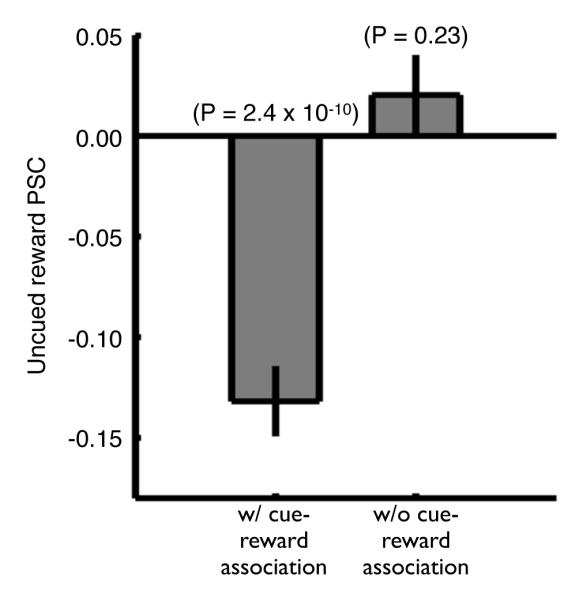
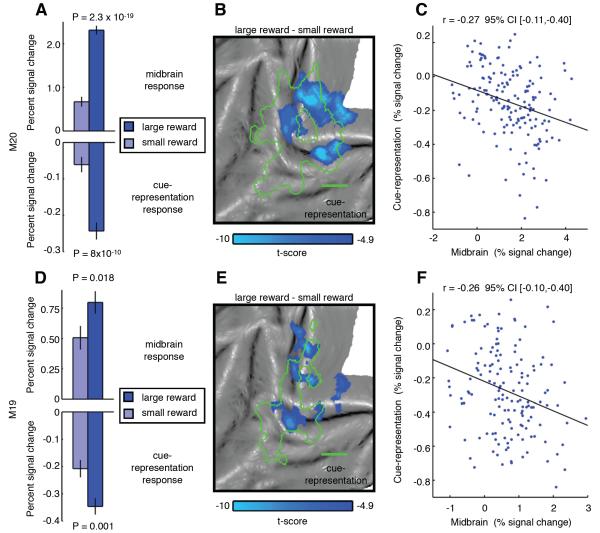
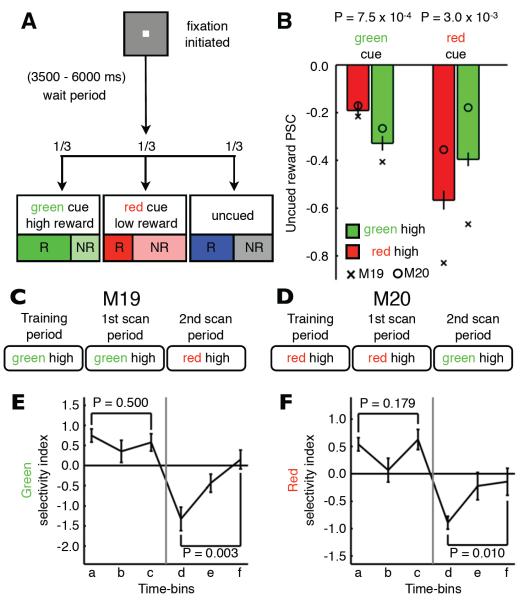
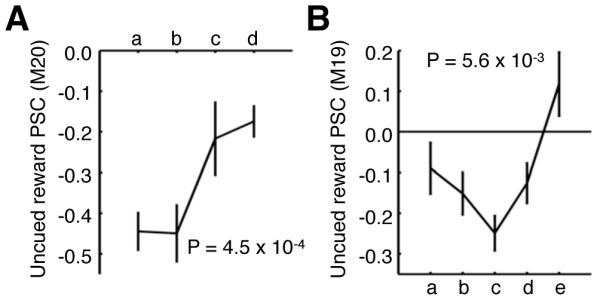
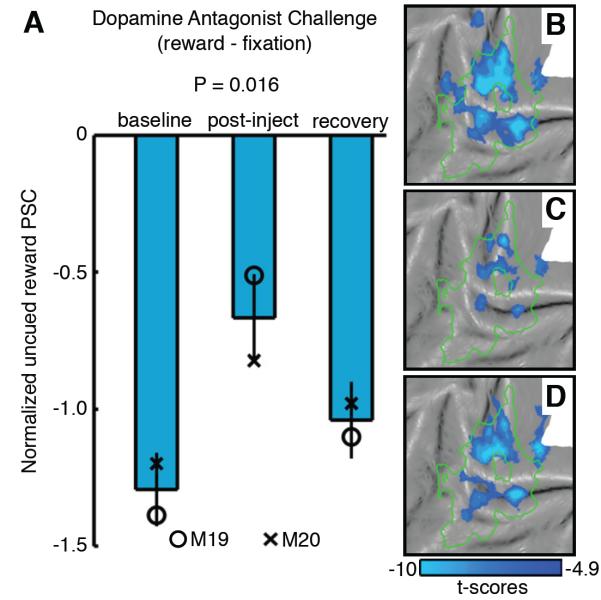
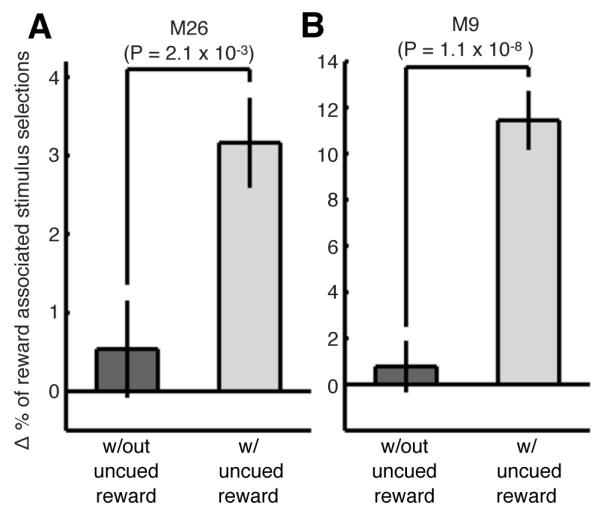
Stimulus-reward coupling without attention can induce highly specific perceptual learning effects, suggesting that reward triggers selective plasticity within visual cortex. Additionally, dopamine-releasing events-temporally surrounding stimulus-reward associations-selectively enhance memory. These forms of plasticity may be evoked by selective modulation of stimulus representations during dopamine-inducing events. However, it remains to be shown whether dopaminergic signals can selectively modulate visual cortical activity. We measured fMRI activity in monkey visual cortex during reward-only trials apart from intermixed cue-reward trials. Reward without visual stimulation selectively decreased fMRI activity within the cue representations that had been paired with reward during other trials. Behavioral tests indicated that these same uncued reward trials strengthened cue-reward associations. Furthermore, such spatially-specific activity modulations depended on prediction error, as shown by manipulations of reward magnitude, cue-reward probability, cue-reward familiarity, and dopamine signaling. This cue-selective negative reward signal offers a mechanism for selectively gating sensory cortical plasticity.


Figures

Figure 1
Figure 1. Design of 2-by-2 experiment (experiment 1)
(A) 2-by-2 factorial design (visual cue and juice reward). All event types (fixation, uncued reward, cue, cue-reward) were equiprobable. (B) Timing of an individual cue-reward trial. The timing of the juice reward and the visual cue were the same in the uncued reward and cue trials, respectively. See also Table S1 and Figure S1.
Figure 2
Figure 2. Spatially-selective reward-induced deactivations in visual cortex without visual stimulation (experiment 1)
(A) Uncued reward fMRI activity measured in 2-by-2 experiment (uncued reward – fixation, P < 0.05 FWE corrected, group-level analysis, 181 runs, M13 - 61 runs, M18 - 62 runs, M19 - 58 runs) and (B) cue localizer fMRI activity (see Table S1) projected onto a flattened representation of left occipital cortex. (C) Uncued reward activity (blue outline) overlaid onto cue localizer activity (orange-yellow). (D) Beta values from group-level analysis of all voxels in area V4 (871 voxels) for visual cue (x-axis, green cue - fixation, localizer experiment) and uncued rewards (y-axis, uncued reward - fixation, experiment 1). (E) Correlation of cue localizer and uncued reward activity across all voxels in a given visual region (group-level analysis). Blue bars represent the mean correlation coefficients. Error bars represent the 95% confidence interval (CI) of the correlation coefficients computed using a bootstrap algorithm (5000 samples). Symbols denote the mean correlation coefficients of separate single-subject analyses [M13 (cross); M18 (square); M19 (circle)]. Asterisks denote significant correlations in the group and in all individuals (P < 0.05, Bonferroni–Holm corrected for multiple comparisons across 6 ROIs). See also Table S2 and Figure S2.
Figure 3
Figure 3. Comparison of reward modulations during cued & uncued trials
(A) Reward modulation during cued trials projected onto a flattened representation of left occipital cortex (cue reward – cue, P < 0.001, group-level analysis, 181 runs, M13 - 61 runs, M18 - 62 runs, M19 - 58 runs) and the cue-representation (see Table S1). (B) Group mean reward modulation PSC within the cue-representation (V3, V4 and TEO, see Table S1) during cued (cue reward – cue) and uncued trials (uncued reward – fixation). Error bars denote the SEM across runs. Significance determined using Wilcoxon rank sum test.
Figure 4
Figure 4. Uncued reward activity with and without surrounding cue-reward trials (Experiments 1 & 2)
Group mean uncued reward PSC within the cue-representation (V3, V4 and TEO, see Table S1) during experiment 1 (with cue-reward association, 80 runs, M18 - 40 runs, M19 - 40 runs) and experiment 2 (without cue-reward association, 80 runs, M22 - 40 runs, M23 - 40 runs). Error bars denote the SEM across runs. Significance determined using a Wilcoxon signed rank test. See also Table S3 and Figure S3.
Figure 5
Figure 5. Size of uncued reward modulates fMRI activity within ventral midbrain and visual cue-representation (experiment 3)
Mean PSC of large reward and small uncued rewards relative to fixation trials for (A) M20 (82 runs) and (D) M19 (76 runs) measured within a ventral midbrain ROI (see Experimental Procedures) and the cue-representation (see Table S1). Error bars denote SEM across runs. Significance between large and small uncued rewards PSC determined using Wilcoxon rank sum test. (M20 - B, M19 - E). Difference in fMRI activity between large and small uncued rewards (large uncued reward - small uncued reward, P < 0.05 FWE corrected) projected onto a flattened cortical representation of left occipital cortex with cue localizer activity boundaries overlaid (green outline). (M20 - C, M19 - F) Run-by-run PSC for reward conditions (small uncued reward and large uncued rewards) relative to fixation trials monitored in the ventral midbrain and the cue-representation. Black line denotes the least squares line of best fit. Significance of correlation determined using bootstrap algorithm (5000 samples) to estimate the 95% CI. See also Table S4 and Figure S4.
Figure 6
Figure 6. Cue-reward relationships modulate uncued reward activity in visual cortex
(A) Design of cue–value experiment (experiment 4) (green, high reward-probability example, 66% green cue rewarded (R), 66% red cue not rewarded (NR), 50% of uncued trials rewarded). (B) Mean PSC during uncued rewards (uncued reward - fixation, 117 runs, M19 - 66 runs, M20 - 51 runs) measured within the green (left) and red (right) cue-representations (see Table S1). Bar color indicates the high reward-probability cue. Error bars denote SEM across runs. Symbols denote the mean PSC of individuals [M19 (cross); M20 (circle)]. Wilcoxon rank sum test compared PSC during green and red high reward-probability scan periods. The timeline of the cue-reward relationships that (C) M19 and (D) M20 were exposed to during the training phase and first and second scan periods. (E) Mean green-cue selectivity index over the timecourse of the experiment (M19, 2 scan periods, 3 time-bins/scan period, 22 runs/time-bin). (F) Mean red cue selectivity index over the timecourse of the experiment (M20, 2 scan periods, 3 time-bins/scan period, 17 runs/time-bin). In both (E) and (F), error bars denote SEM across runs and significance was determined using Kruskal-Wallis non-parametric ANOVA across the three time-bins in a given scan period. See also Table S5 and Figure S5.
Figure 7
Figure 7. Uncued reward activity decreases after prolonged exposure to an absolute cue-reward relationship (experiment 5)
Mean PSC of uncued rewards (uncued reward – fixation) separated into equal-length time-bins within the 100% reward predicting cue-representation for (A) M20 (green representation, 15 runs/time-bin) and (B) M19 (red representation, 14 runs/time-bin). Time-bins comprise runs acquired at progressively later time points during the experiment. See Table S1 for cue-representation definitions. Error bars denote SEM. Significance determined using Kruskal-Wallis non-parametric ANOVA comparing the PSC across time-bins. See also Table S6 and Figure S6.
Figure 8
Figure 8. Uncued reward activity in visual cortex is susceptible to dopamine D1-receptor antagonist (SCH-23390) challenge (experiment 6)
(A) Mean normalized PSC (see Supplemental Experimental Procedures) during uncued rewards (uncued reward – fixation, group-level analysis, 30 runs/phase, M19 & M20 - 15 runs/phase) within the cue-representation (see Table S1) measured during baseline, post-injection and recovery phases. Error bars denote SEM across runs. Symbols denote the mean normalized PSC of single-subject analyses [M19 (circle); M20 (cross)]. Kruskal-Wallis non-parametric ANOVA was performed comparing PSC across phases. Uncued reward fMRI activity (uncued reward – fixation, P < 0.05 FWE corrected group-level analysis, 30 runs/phase, M19 & M20 - 15 runs/phase) projected onto a flattened cortical representation of left occipital cortex during the (B) baseline, (C) post-injection, and (D) recovery phases. Green outline represents the cue-representation. See also Table S7 and Figure S8.
Figure 9
Figure 9. Uncued rewards alter the strength of cue-reward associations: behavioral evidence (experiment 7)
Changes in stimulus selection (for stimuli that were initially non-preferred for the monkey) obtained during the behavioral preference sessions. The 400 trials from the pre- and post-association preference test in each session were grouped into bins of 20 trials. The percent change in the monkey’s stimulus selection for (A) M26 (26 sessions) and (B) M9 (9 sessions) was determined by comparing the number of selections within a bin after the association block with the number of selections within the corresponding bin before the association block relative to the total number of trials in the bin. This was performed for sessions with association blocks that contained uncued rewards (blue bars) and alternating sessions that did not (grey bars). Error bars denote the SEM over bins. A significant difference in stimulus selection was determined using a Wilcoxon rank sum test comparing experiments with and without uncued rewards.

Similar articles

Cited by

References

    1. Adab HZ, Vogels R. Practicing coarse orientation discrimination improves orientation signals in macaque cortical area v4. Curr Biol. 2011;21:1661–1666. - PubMed
    1. Anderson BA, Laurent PA, Yantis S. Value-driven attentional capture. Proc Natl Acad Sci U S A. 2011;108:10367–10371. - PMC - PubMed
    1. Bao S, Chan VT, Merzenich MM. Cortical remodelling induced by activity of ventral tegmental dopamine neurons. Nature. 2001;412:79–83. - PubMed
    1. Blaiss CA, Janak PH. Post-training, but not post-reactivation, administration of amphetamine and anisomycin modulates Pavlovian conditioned approach. Neurobiol Learn Mem. 2007;87:644–658. - PMC - PubMed
    1. Bromberg-Martin ES, Matsumoto M, Hikosaka O. Dopamine in motivational control: rewarding, aversive, and alerting. Neuron. 2010;68:815–834. - PMC - PubMed

Publication types