

Clinical implication of centrosome amplification and expression of centrosomal functional genes in multiple myeloma
- PMID: 23522059
- PMCID: PMC3615957
- DOI: 10.1186/1479-5876-11-77
Clinical implication of centrosome amplification and expression of centrosomal functional genes in multiple myeloma
Abstract
Background: Multiple myeloma (MM) is a low proliferative tumor of postgerminal center plasma cell (PC). Centrosome amplification (CA) is supposed to be one of the mechanisms leading to chromosomal instability. Also, CA is associated with deregulation of cell cycle, mitosis, DNA repair and proliferation. The aim of our study was to evaluate the prognostic significance and possible role of CA in pathogenesis and analysis of mitotic genes as mitotic disruption markers.
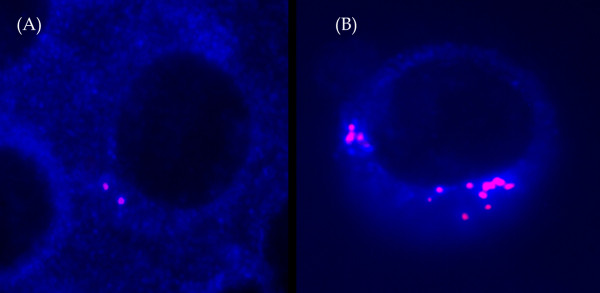
Design and methods: A total of 173 patients were evaluated for this study. CD138+ cells were separated by MACS. Immunofluorescent labeling of centrin was used for evaluation of centrosome amplification in PCs. Interphase FISH with cytoplasmic immunoglobulin light chain staining (cIg FISH) and qRT-PCR were performed on PCs.
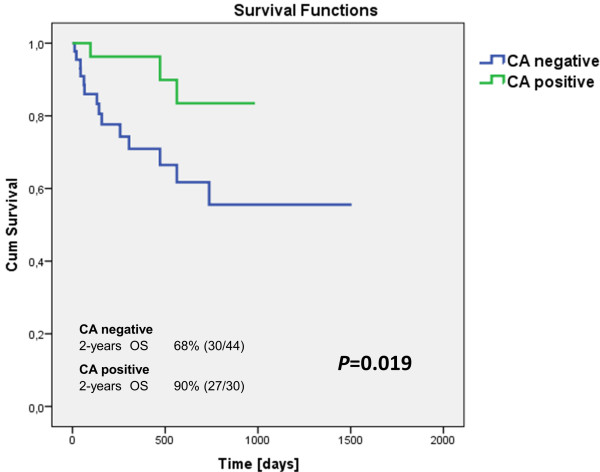
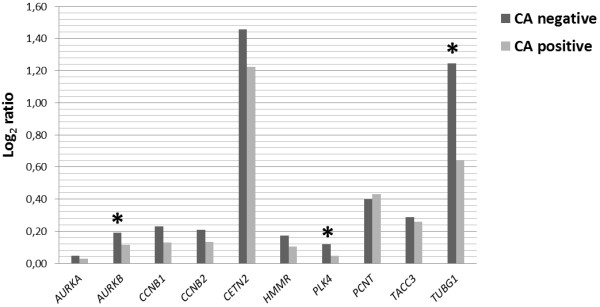
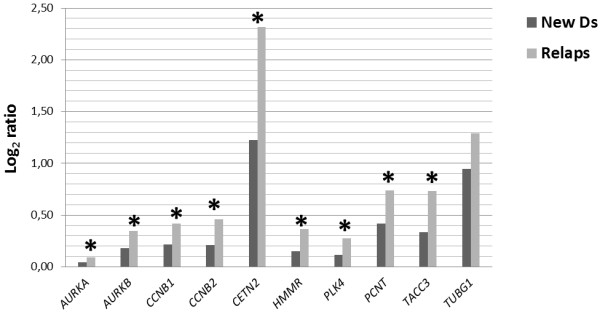
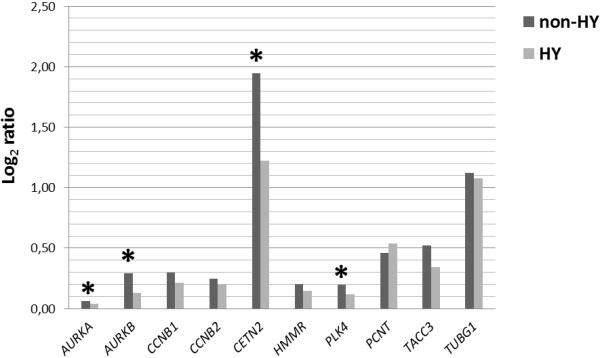
Results: Based on the immunofluorescent staining results, all patients were divided into two groups: CA positive (38.2%) and CA negative (61.8%). Among the newly diagnosed patients, worse overall survival was indicated in the CA negative group (44/74) in comparison to the CA positive group (30/74) (P = 0.019). Gene expression was significantly down-regulated in the CA positive group in comparison to CA negative in the following genes: AURKB, PLK4, TUBG1 (P < 0.05). Gene expression was significantly down-regulated in newly diagnosed in comparison to relapsed patients in the following genes: AURKA, AURKB, CCNB1, CCNB2, CETN2, HMMR, PLK4, PCNT, and TACC3 (P < 0.05).
Conclusions: Our findings indicate better prognosis for CA positive newly diagnosed patients. Considering revealed clinical and gene expression heterogeneity between CA negative and CA positive patients, there is a possibility to characterize centrosome amplification as a notable event in multiple myeloma pathogenesis.
Figures
Similar articles
-
Centrosome associated genes pattern for risk sub-stratification in multiple myeloma.J Transl Med. 2016 May 28;14(1):150. doi: 10.1186/s12967-016-0906-9. J Transl Med. 2016. PMID: 27234807 Free PMC article.
-
Centrosome amplification as a possible marker of mitotic disruptions and cellular carcinogenesis in multiple myeloma.Leuk Res. 2010 Aug;34(8):1007-11. doi: 10.1016/j.leukres.2009.12.018. Epub 2010 Jan 21. Leuk Res. 2010. PMID: 20096458
-
[Investigation of 1q21 amplification in patients with multiple myeloma using I-FISH and cIg-FISH].Zhonghua Yi Xue Yi Chuan Xue Za Zhi. 2011 Dec;28(6):686-9. doi: 10.3760/cma.j.issn.1003-9406.2011.06.020. Zhonghua Yi Xue Yi Chuan Xue Za Zhi. 2011. PMID: 22161106 Chinese.
-
Centrosome amplification and clonal evolution in multiple myeloma: Short review.Crit Rev Oncol Hematol. 2016 Feb;98:116-21. doi: 10.1016/j.critrevonc.2015.10.019. Epub 2015 Nov 2. Crit Rev Oncol Hematol. 2016. PMID: 26589397 Review.
-
Centrosomes and myeloma; aneuploidy and proliferation.Environ Mol Mutagen. 2009 Oct;50(8):697-707. doi: 10.1002/em.20528. Environ Mol Mutagen. 2009. PMID: 19739237 Free PMC article. Review.
Cited by
-
γ-Tubulin⁻γ-Tubulin Interactions as the Basis for the Formation of a Meshwork.Int J Mol Sci. 2018 Oct 19;19(10):3245. doi: 10.3390/ijms19103245. Int J Mol Sci. 2018. PMID: 30347727 Free PMC article. Review.
-
γ-tubulin as a signal-transducing molecule and meshwork with therapeutic potential.Signal Transduct Target Ther. 2018 Sep 14;3:24. doi: 10.1038/s41392-018-0021-x. eCollection 2018. Signal Transduct Target Ther. 2018. PMID: 30221013 Free PMC article. Review.
-
Centrosome associated genes pattern for risk sub-stratification in multiple myeloma.J Transl Med. 2016 May 28;14(1):150. doi: 10.1186/s12967-016-0906-9. J Transl Med. 2016. PMID: 27234807 Free PMC article.
-
MiR-654-3p Suppresses Non-Small Cell Lung Cancer Tumourigenesis by Inhibiting PLK4.Onco Targets Ther. 2020 Aug 13;13:7997-8008. doi: 10.2147/OTT.S258616. eCollection 2020. Onco Targets Ther. 2020. PMID: 32884289 Free PMC article.
-
γ-Tubulin complexes in microtubule nucleation and beyond.Mol Biol Cell. 2015 Sep 1;26(17):2957-62. doi: 10.1091/mbc.E14-11-1514. Mol Biol Cell. 2015. PMID: 26316498 Free PMC article.
References
-
- Nigg EA. Centrosome aberrations: cause or consequence of cancer progression? Nat Rev Cancer. 2002;2:815–825. - PubMed
-
- Ried T, Heselmeyer-Haddad K, Blegen H, Schrock E, Auer G. Genomic changes defining the genesis, progression, and malignancy potential in solid human tumors: a phenotype/genotype correlation. Genes Chromosomes Cancer. 1999;25:195–204. doi: 10.1002/(SICI)1098-2264(199907)25:3<195::AID-GCC1>3.0.CO;2-8. - DOI - PubMed
Publication types
MeSH terms
Substances
LinkOut - more resources
Full Text Sources
Other Literature Sources
Medical
Miscellaneous
