Meta-Analysis
. 2013 Mar 22:14:37.
doi: 10.1186/1471-2202-14-37.

Improving basic and translational science by accounting for litter-to-litter variation in animal models

Affiliations
Meta-Analysis

Improving basic and translational science by accounting for litter-to-litter variation in animal models

Stanley E Lazic et al. BMC Neurosci. .

Abstract

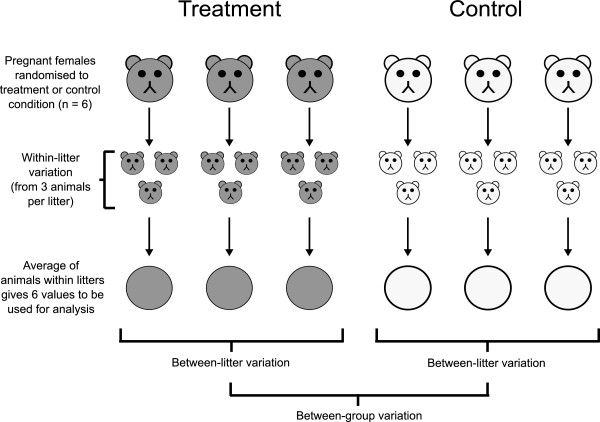
Background: Animals from the same litter are often more alike compared with animals from different litters. This litter-to-litter variation, or "litter effects", can influence the results in addition to the experimental factors of interest. Furthermore, sometimes an experimental treatment can only be applied to whole litters rather than to individual offspring. An example is the valproic acid (VPA) model of autism, where VPA is administered to pregnant females thereby inducing the disease phenotype in the offspring. With this type of experiment the sample size is the number of litters and not the total number of offspring. If such experiments are not appropriately designed and analysed, the results can be severely biased as well as extremely underpowered.

Results: A review of the VPA literature showed that only 9% (3/34) of studies correctly determined that the experimental unit (n) was the litter and therefore made valid statistical inferences. In addition, litter effects accounted for up to 61% (p<0.001) of the variation in behavioural outcomes, which was larger than the treatment effects. In addition, few studies reported using randomisation (12%) or blinding (18%), and none indicated that a sample size calculation or power analysis had been conducted.

Conclusions: Litter effects are common, large, and ignoring them can make replication of findings difficult and can contribute to the low rate of translating preclinical in vivo studies into successful therapies. Only a minority of studies reported using rigorous experimental methods, which is consistent with much of the preclinical in vivo literature.


Figures

Figure 1
Figure 1
Defining the experimental unit. Pregnant females are the experimental units because they are randomised to the treatment (e.g. valproic acid) or control conditions and therefore n = 6 in this example. The three offspring within a litter will often be more alike than offspring from different litters Between litter variationWithin litter variation>1 and multiple offspring within a litter can be thought of as subsamples or “technical replicates”, even though these are the scientific unit of interest. Only the mean of the within-litter values are important when comparing treated and control groups. Using all of the offspring without averaging will result in an inflated sample size (pseudoreplication) with standard statistical analyses. Instead of averaging, one could randomly select only one animal from each litter, or use a mixed-effects model to appropriately partition the different sources of variation. The only way to increase sample size, and thus power, is to increase the number of litters used.
Figure 2
Figure 2
Analysis with and without litter taken into account. Nine pregnant female C57BL/6 mice were injected with 600 mg/kg VPA subcutaneously on embryonic day 13, and five control females received vehicle injections. Half of the animals in each condition were also injected with either a mGluR5 receptor antagonist (MPEP) or saline postnatally. Total locomotor activity in the open field over a 30 min period at 8–9 weeks of age is shown. There was a slight increase in activity due to MPEP, but it was not significant when differences between litters were ignored (A; two-way ANOVA, mean difference = 0.60, F(1,44) = 3.17, p = 0.082). Adjusting for litter removed unexplained variation in the data, allowing the small difference between groups to become statistically significant (B; mixed-effects model, mean difference = 0.64, F(1,32) = 7.19, p = 0.011). Note how the values in the second graph have less variability around the group means; this increased precision leads to greater power of the statistical tests. Lines go through the mean of each group and points are jittered in the x direction.
Figure 3
Figure 3
Visualising litter-to-litter variation. The residuals represent the unexplained variation in the data after the effects of VPA and MPEP have been taken into account; they should be pure noise and therefore not associated with any other variable. However, the standard analysis (A) shows that when residuals are plotted against litter (x-axis) there are large differences between litters. In other words, there is another factor affecting the outcome besides the experimental factors of interest. The variance of the residuals (grey points on the right) is high (σε2 = 1.29). The proper analysis (B) reduces the unexplained variation in the data by 61% (σε2 = 0.50; p < 0.001), which can be seen by the narrower spread of the grey points around zero, and the large differences between the litters have been removed. This reduction in noise allows smaller true signals to be detected. Error bars are SEM. Litters F and L only have one observation and thus no error bars.
Figure 4
Figure 4
Power calculations for VPA experiments. Panel A shows how power changes as the number of animals per litter increases from one to eight (x-axis) and the number of litters per group increases from three to ten (different lines). It is clear that increasing the number of animals per litter has only a modest effect on power with little improvement after two animals. A two-group study with three litters per group and eight animals per litter (2 × 3 × 8 = 48 animals) will have only a 30% chance of detecting the effect, whereas a study with ten litters per group and one animal per litter (2 × 10 × 1 = 20 animals) will have almost 80% power and also use far fewer animals. Panel B shows the same data, but presented differently. Power for different combinations of litters and animals per litter is indicated by colour (red = low power, white = high) and reference lines for 70%, 80%, and 90% power are indicated. Note that these specific power values are only relevant for the locomotor activity task with a fixed effect size and will have to be recalculated for other outcomes. However, the general result (increasing litters is better than increasing the number of animals per litter) will apply for all outcomes.

Similar articles

Cited by

References

    1. Geerts H. Of mice and men: bridging the translational disconnect in CNS drug discovery. CNS Drugs. 2009;23(11):915–926. doi: 10.2165/11310890-000000000-00000. [ http://dx.doi.org/10.2165/11310890-000000000-00000] - DOI - DOI - PubMed
    1. Haseman JK, Hogan MD. Selection of the experimental unit in teratology studies. Teratol. 1975;12(2):165–171. doi: 10.1002/tera.1420120209. - DOI - PubMed
    1. Hughes CW. Outcome of early experience studies as affected by between-litter variance. J Nutr. 1979;109(4):642–645. - PubMed
    1. Holson RR, Pearce B. Principles and pitfalls in the analysis of prenatal treatment effects in multiparous species. Neurotoxicol Teratol. 1992;14(3):221–228. doi: 10.1016/0892-0362(92)90020-B. - DOI - PubMed
    1. Zorrilla EP. Multiparous species present problems (and possibilities) to developmentalists. Dev Psychobiol. 1997;30(2):141–150. doi: 10.1002/(SICI)1098-2302(199703)30:2<141::AID-DEV5>3.0.CO;2-Q. - DOI - PubMed

Publication types