. 2013 Apr 15;25(1):55-68.
doi: 10.1016/j.devcel.2013.01.028. Epub 2013 Mar 21.

Mammalian X upregulation is associated with enhanced transcription initiation, RNA half-life, and MOF-mediated H4K16 acetylation

Affiliations

Mammalian X upregulation is associated with enhanced transcription initiation, RNA half-life, and MOF-mediated H4K16 acetylation

Xinxian Deng et al. Dev Cell. .

Abstract

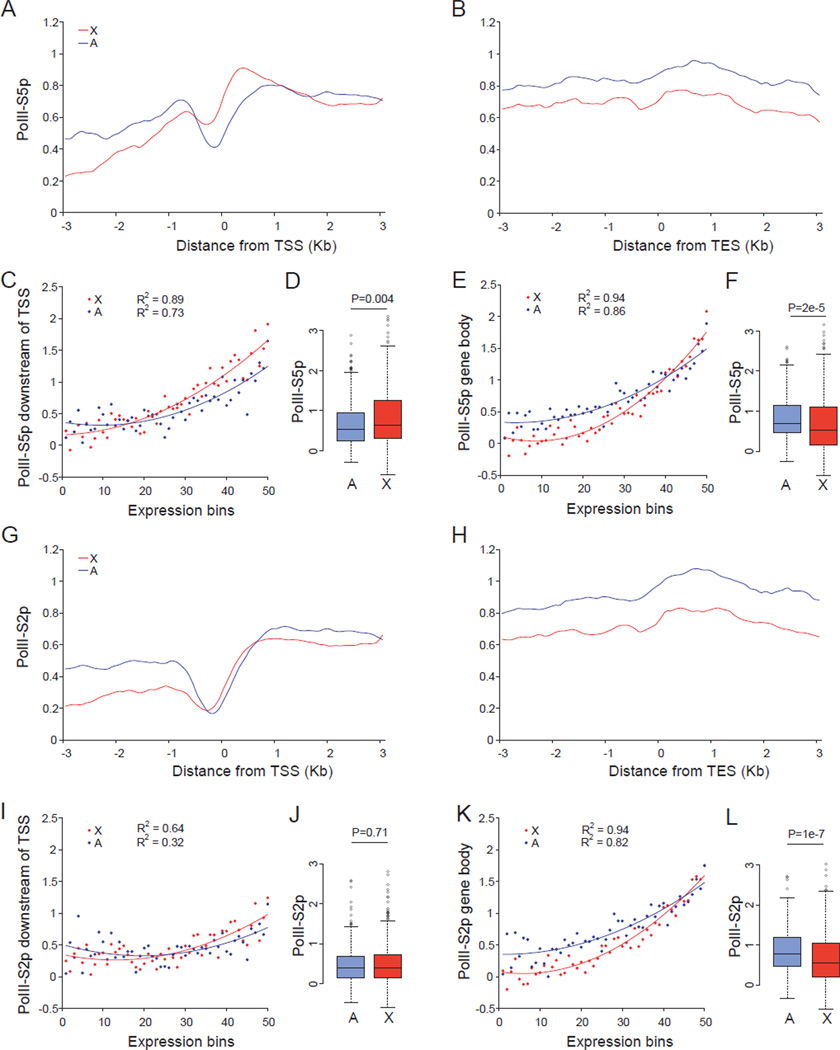
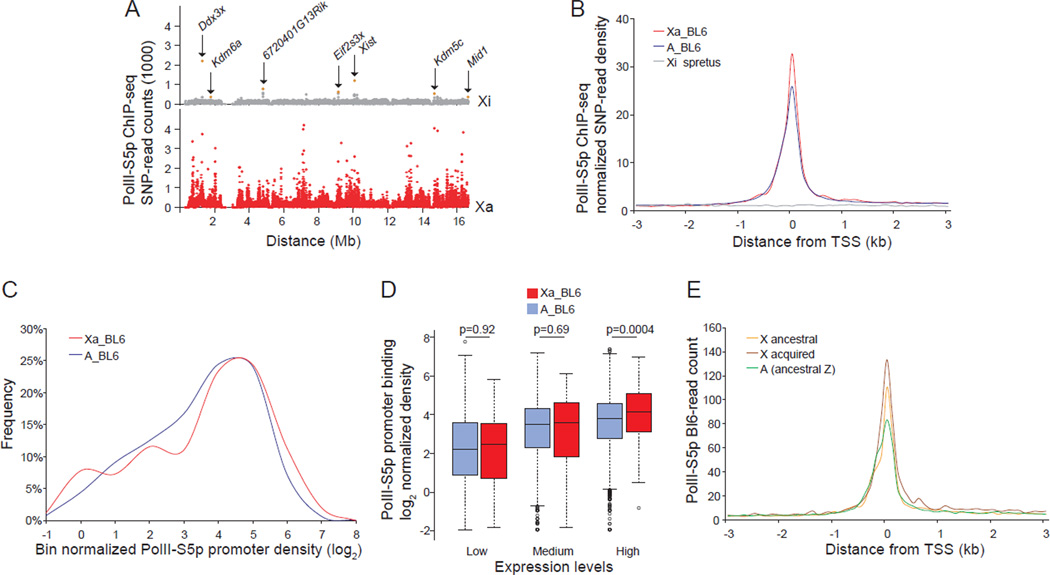
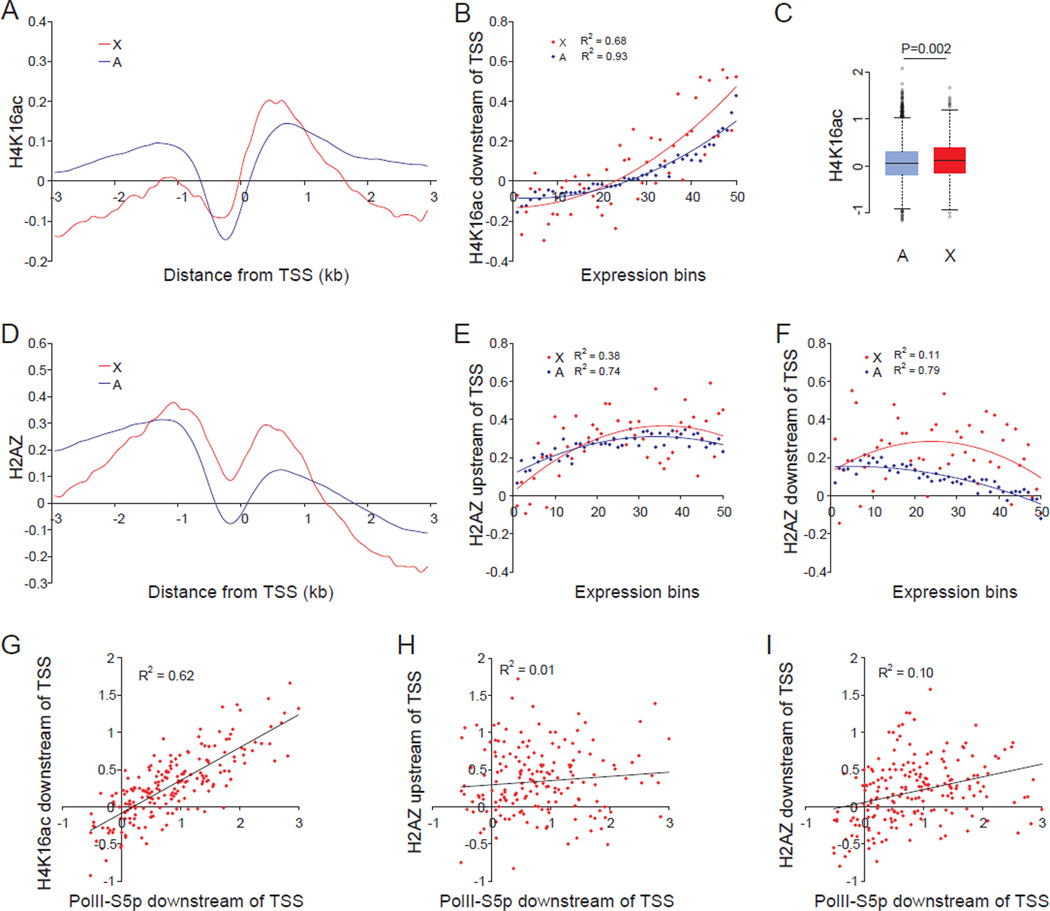
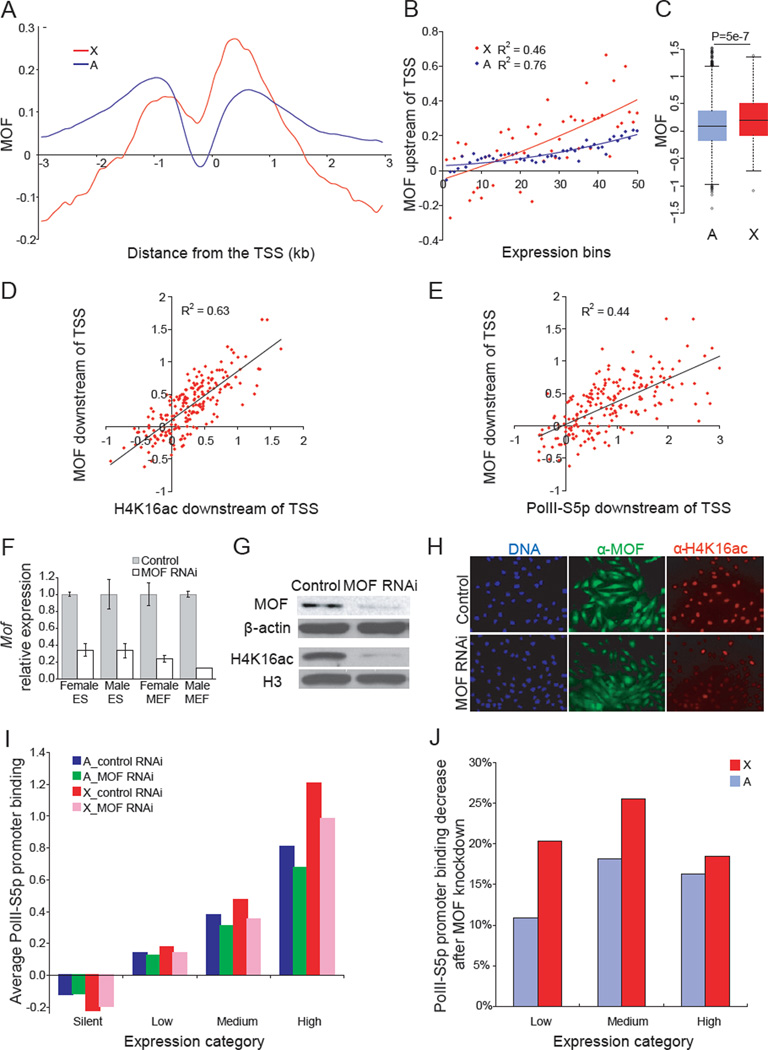
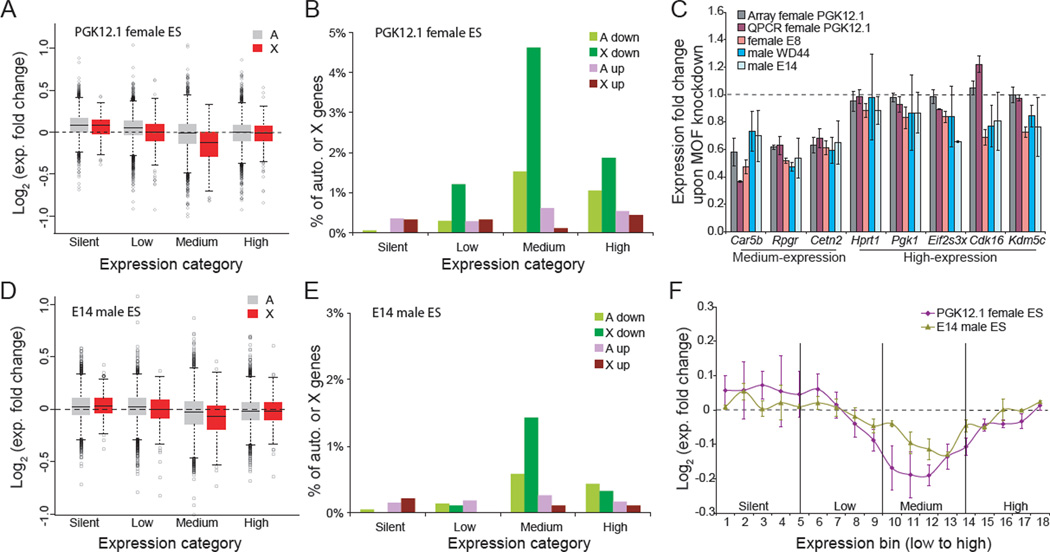
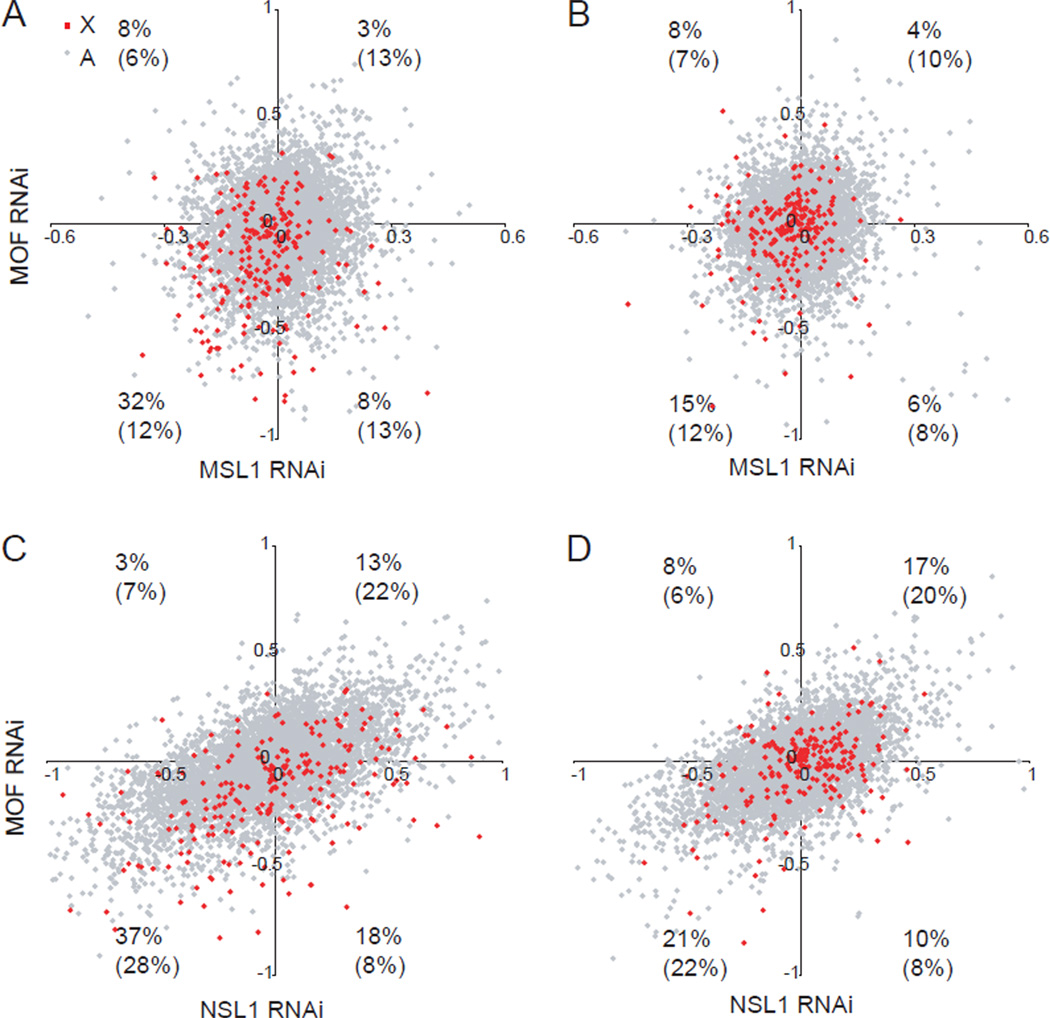
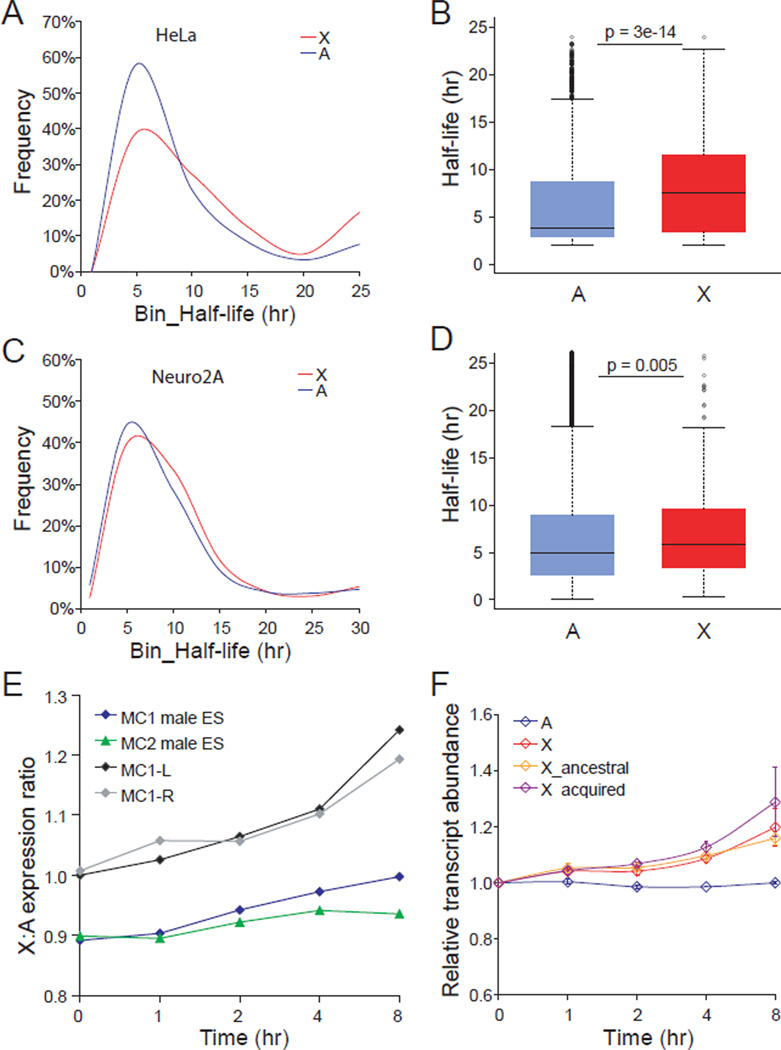
X upregulation in mammals increases levels of expressed X-linked transcripts to compensate for autosomal biallelic expression. Here, we present molecular mechanisms that enhance X expression at transcriptional and posttranscriptional levels. Active mouse X-linked promoters are enriched in the initiation form of RNA polymerase II (PolII-S5p) and in specific histone marks, including histone H4 acetylated at lysine 16 (H4K16ac) and histone variant H2AZ. The H4K16 acetyltransferase males absent on the first (MOF), known to mediate the Drosophila X upregulation, is also enriched on the mammalian X. Depletion of MOF or male-specific lethal 1 (MSL1) in mouse ES cells causes a specific decrease in PolII-S5p and in expression of a subset of X-linked genes. Analyses of RNA half-life data sets show increased stability of mammalian X-linked transcripts. Both ancestral X-linked genes, defined as those conserved on chicken autosomes, and newly acquired X-linked genes are upregulated by similar mechanisms but to a different extent, suggesting that subsets of genes are distinctly regulated depending on their evolutionary history.


Figures

Figure 1
Figure 1. PolII-S5p but not PolII-S2p occupancy is enhanced at expressed X-linked genes in female ES cells
(A–L) ChIP-chip analyses using genome tiling arrays to survey X-linked (X) and autosomal (A) genes in undifferentiated female ES cells PGK12.1. (A–B) Metagene analyses of 355 X-linked and 387 chr19-linked expressed genes (≥1RPKM). Average PolII-S5p occupancy (log2 ChIP/input) was plotted 3kb up- and downstream of the TSS (transcriptional start site) (A) and TES (transcriptional end site) (B) in a 500bp sliding window (100bp intervals). (C–E) Average binding scores of PolII-S5p in a 1kb region downstream of the TSS (C) or in a 3kb region upstream of the TES (3’ gene body) (E) plotted for 50 expression-ranked bins, each containing 10 X-linked and 9 chr19-linked genes. A total of 506 X-linked and 456 chr19-linked genes (>0RPKM) were examined. Regression values (R2) and trend lines are shown. (D–F) Box plots of PolII-S5p occupancy at the promoter (D) and at the 3’ gene body (F) of expressed X-linked and chr19-linked genes (≥1RPKM). P values from Wilcoxon-test are shown. (G–L) Occupancy of PolII-S2p at the 5’ or 3’ end of X-linked and chr19-linked genes. Same analyses as described in (A–F). See also Figure S1.
Figure 2
Figure 2. Higher PolII-S5p occupancy at expressed X-linked versus autosomal genes by allele-specific ChIP-seq analyses in brain
(A–E) Allele-specific ChIP-seq in brain of an F1 mouse with the BL6 X chromosome active (Xa), and the spretus X inactive (Xi). (A) Chromosome-wide allele-specific PolII-S5p occupancy profiles of the Xa and Xi are shown as SNP read counts in 10kb windows. Read counts for genes that escape X inactivation (Ddx3x, Kdm6a, 6720401G13Rik, Eif2s3x, Xist, Kdm5c, Mid1) are indicated (pink dots). (B) Metagene analysis of PolII-S5p occupancy at the 5' end of expressed genes (≥1RPKM) on the Xa (Xa_BL6) (398 X-linked genes) and on the haploid set of autosomes (A_BL6) (11335 autosomal genes). SNP-read counts plotted 3kb up- and downstream of the TSS in 100bp windows. (C) Percentage of expressed genes with PolII-S5p promoter occupancy is higher on the Xa (Xa_BL6) than on autosomal genes from the same haploid set (A_BL6) (p =0.007, KS (Kolmogorov–Smirnov)-test). Normalized promoter PolII-S5p density was calculated by averaging SNP-read counts in six 100bp windows around the TSS (peak region) for expressed genes, and normalizing by the median value of genomic DNA-SNP-read counts 3kb up- and downstream of the TSS. (D) Box plots of normalized allele-specific promoter PolII-S5p density on expressed genes on the Xa compared to those on the haploid set of autosomes in each of the expression groups (low-, medium-, and high-expression). P values from Wilcoxon-test are shown. (E) Metagene analysis of PolII-S5p allele-specific occupancy at the 5' end of expressed ancestral X-linked genes (282 genes) and acquired X-linked genes (155 genes), compared to ancestral autosomal genes (421 genes). See also Figure S2.
Figure 3
Figure 3. Higher levels of H4K16ac and H2AZ at the 5’ end of expressed X-linked versus autosomal genes in female ES cells
(A–I) ChIP-chip analyses using promoter arrays in undifferentiated female ES cells PGK12.1. Regression values (R2) are shown where appropriate. (A) Metagene analysis of H4K16ac at the promoter-proximal region of expressed X-linked (X) and autosomal (A) genes. Average enrichment (log2 ChIP/input) was plotted 3kb up- and downstream of the TSS for 387 X-linked and 9800 autosomal expressed genes (≥1RPKM). (B) Average binding scores of H4K16ac in a 1kb region downstream of the TSS plotted for 50 expression-ranked bins, each containing 10 X-linked and 255 autosomal genes. A total of 506 X-linked and 12755 autosomal genes (>0RPKM) were examined. (C) Box plots of promoter-binding scores of H4K16ac on expressed X-linked and autosomal genes (≥1RPKM). P value from Wilcoxon-test is shown. (D) Metagene analysis of H2AZ at the 5’ end of expressed X-linked and autosomal genes. Same analysis as in (A). (E–F) Average binding scores of H2AZ in a 0.5–1.5kb region upstream of the TSS (E) and a 1kb region downstream of the TSS (F). Same analysis as in (B). (G–I) PolII-S5p promoter-proximal occupancy at expressed X-linked genes is well correlated with H4K16ac promoter enrichment (G) but not with H2AZ (H–I). See also Figures S3 and S4.
Figure 4
Figure 4. MOF is enriched at the 5'end of X-linked genes and knockdown reduces accumulation of H4K16ac and PolII-S5p occupancy
(A–E) ChIP-chip analyses using promoter arrays in undifferentiated female ES cells PGK12.1. Regression values (R2) are shown where appropriate. (A) Metagene analysis of MOF occupancy at the promoter-proximal region of expressed X-linked (X) and autosomal (A) genes. Same analysis as in Figure 3A. (B) Average binding scores of MOF in a 1kb region downstream of the TSS plotted for 50 expression-ranked bins. Same analysis as in Figure 3B. (C) Box plots of promoter-binding scores of MOF on expressed X-linked and autosomal genes (≥1RPKM). P value from Wilcoxon-test is shown. (D–E) Correlations between MOF promoter-proximal occupancy at expressed X-linked genes with H4K16ac (D) and PolII-S5p promoter enrichment (E). (F–H) qRT-PCR (F), western blots (G) and immunostaining (H) in control (scramble siRNA) and MOF RNAi treated cells. Mof expression set to 1 in control cells and β-actin used for normalization. Error bars represent standard deviation (SD). β-ACTIN and H3 antibodies serve as controls for the western blot. DNA stained by Hoechst 33342 (blue). (I) Average PolII-S5p promoter binding scores within 1kb downstream of the TSS for 626 X-linked and 15944 autosomal genes grouped in four expression categories (see Experimental Procedures), compared between control undifferentiated female ES cells PGK12.1 (control RNAi) and MOF knockdown (MOF RNAi). (J) Percentages of PolII-S5p promoter binding after MOF knockdown for expressed X-linked (X) and autosomal (A) genes in three expression categories. See also Figure S5.
Figure 5
Figure 5. MOF knockdown specifically decreases expression of X-linked genes in female and male ES cells
(A) Box plots of expression fold changes for X-linked (X) and autosomal (A) genes grouped in four expression categories (see Experimental Procedures) after MOF knockdown in undifferentiated female ES cells PGK12.1. X-linked genes with medium expression levels show the most significant decrease compared to autosomal genes (p <2e-16, one-way ANOVA), or to X-linked genes in other categories (p <6e-10). (B) Percentages of X-linked (X) and autosomal (A) genes in each expression category with a >1.2-fold expression change (p <0.05, two-tail paired t-test) after MOF knockdown in undifferentiated female ES cells PGK12.1. Genes with decreased expression (down) or with increased expression (up) are indicated. (C) Quantitative RT-PCR analyses of the effects of MOF knockdown on expression of three medium-expressed (Car5b Rpgr, and Cetn2) and five highly expressed (Hprt1, Pgk1, Eif2s3x, Cdk16 and Kdm5c) X-linked genes in male (WD44 and E14) and female (PGK12.1 and E8) ES cells. The 18S housekeeping gene was used for normalization. Error bars represent SD. (D) Box plots of expression fold changes for X-linked (X) and autosomal (A) genes grouped in four expression categories after MOF knockdown in undifferentiated male ES cells E14. X-linked genes with medium expression levels show the most significant decrease compared to autosomal genes (p <8e-5, one-way ANOVA), or to X-linked genes in other categories (p <0.0004). (E) Percentages of X-linked (X) and autosomal (A) genes in each expression category with a >1.2-fold expression change (p <0.05, two-tail paired t-test) after MOF knockdown in undifferentiated male ES cells E14. Same analysis as in Figure 5B. (F) Expression of X-linked genes sorted in 18 expression–ranked bins (each containing 50 X-linked genes) after MOF knockdown in undifferentiated male ES cells E14 (one active X) and female ES cells PGK12.1 (two active Xs). Average log2 fold change between knockdown and control is shown. Error bars represent SD. See also Figure S6 and Table S1.
Figure 6
Figure 6. A high percentage of medium-expressed X-linked genes is specifically co-downregulated after MOF or MSL1 (but not NSL1) knockdown
(A–B) Comparison of expression fold changes (log2) between MOF and MSL1 knockdown for X-linked (red) and autosomal (gray) genes in the medium-expression (A) and high-expression (B) categories (representing a total of 227 X-linked and 5316 autosomal genes in each category). The percentages of X-linked and autosomal genes (in parentheses) with greater than 10% change in expression (±0.1 in log2) in both knockdowns are indicated in each quadrant. (C–D) Comparison of expression fold changes between MOF and NSL1 knockdown. Similar analysis as in (A–B). See also Table S2.
Figure 7
Figure 7. Longer half-life of X-linked transcripts compared to autosomal transcripts in mammalian cells
(A) Distribution of half-life for 327 X-linked and 10252 autosomal transcripts in human HeLa cells shows a higher percentage of X-linked transcripts with long half-life (p=6e-13, KS-test). Published BRIC-seq data were re-analyzed (Tani et al., 2012). Only expressed genes with >1RPKM were included. (B) Box plots of half-life for human X-linked and autosomal transcripts. P values by Wilcoxon-test are shown. (C) Distribution of half-life for 266 X-linked and 9131 autosomal transcripts in mouse Neuro-2A cells shows a higher percentage of X-linked transcripts with long half-life (p=0.02, KS-test). Published array data were re-analyzed (Clark et al., 2012). (D) Box plots of half-life for mouse X-linked and autosomal transcripts. P values by Wilcoxon-test are shown. (E) X:autosome expression ratios after inhibition of transcription in male mouse ES cells. Reanalysis based on published microarray data on undifferentiated (MC1, MC2) and differentiated (by either LIF withdrawal (MC1-L) or retinoic acid treatment (MC1-R)) mouse ES cells harvested at 0, 1, 2, 4, and 8hr (hour) after addition of the transcription inhibitor actinomycin D (Sharova et al., 2009). (F) Same analysis as in E for X-linked genes grouped as either ancestral or acquired. The transcript abundance at 0hr was set to 1 and used to calculate the relative transcript abundance of 22166 autosomal (A) genes and of 865 X-linked (X) genes grouped as either ancestral (400 genes) or acquired (465 genes). Means ± SD are shown based on two microarray datasets (MC1-L and MC1-R). See also Figure S7.

Comment in

  • Gene expression: Extra X expression.
    Stower H. Stower H. Nat Rev Genet. 2013 May;14(5):304. doi: 10.1038/nrg3479. Epub 2013 Apr 4. Nat Rev Genet. 2013. PMID: 23552217 No abstract available.

Similar articles

Cited by

References

    1. Adler DA, Rugarli EI, Lingenfelter PA, Tsuchiya K, Poslinski D, Liggitt HD, Chapman VM, Elliott RW, Ballabio A, Disteche CM. Evidence of evolutionary up-regulation of the single active X chromosome in mammals based on Clc4 expression levels in Mus spretus and Mus musculus. Proc Natl Acad Sci U S A. 1997;94:9244–9248. - PMC - PubMed
    1. Akhtar A, Becker PB. Activation of transcription through histone H4 acetylation by MOF, an acetyltransferase essential for dosage compensation in Drosophila. Mol Cell. 2000;5:367–375. - PubMed
    1. Alekseyenko AA, Larschan E, Lai WR, Park PJ, Kuroda MI. High-resolution ChIP-chip analysis reveals that the Drosophila MSL complex selectively identifies active genes on the male X chromosome. Genes Dev. 2006;20:848–857. - PMC - PubMed
    1. Appanah R, Dickerson DR, Goyal P, Groudine M, Lorincz MC. An unmethylated 3' promoter-proximal region is required for efficient transcription initiation. PLoS Genet. 2007;3:e27. - PMC - PubMed
    1. Bellott DW, Skaletsky H, Pyntikova T, Mardis ER, Graves T, Kremitzki C, Brown LG, Rozen S, Warren WC, Wilson RK, et al. Convergent evolution of chicken Z and human X chromosomes by expansion and gene acquisition. Nature. 2010;466:612–616. - PMC - PubMed

Publication types

MeSH terms

Associated data