. 2013 Mar 28;3(3):931-45.
doi: 10.1016/j.celrep.2013.02.023. Epub 2013 Mar 21.

Foxg1 coordinates the switch from nonradially to radially migrating glutamatergic subtypes in the neocortex through spatiotemporal repression

Affiliations

Foxg1 coordinates the switch from nonradially to radially migrating glutamatergic subtypes in the neocortex through spatiotemporal repression

Takuma Kumamoto et al. Cell Rep. .

Abstract

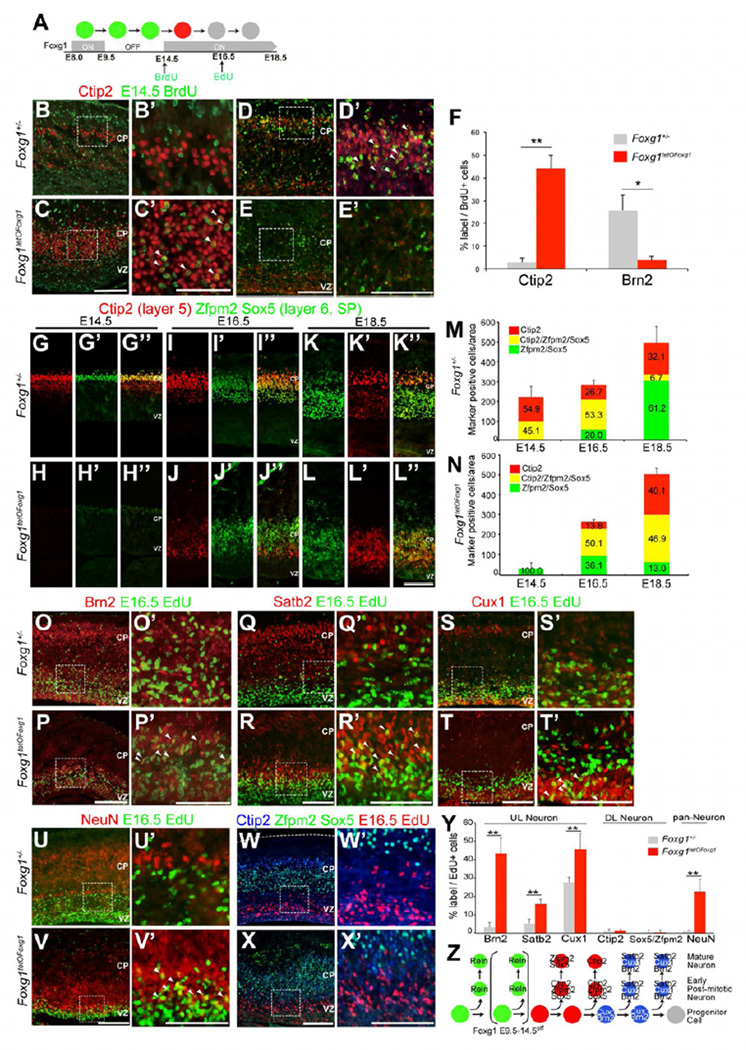
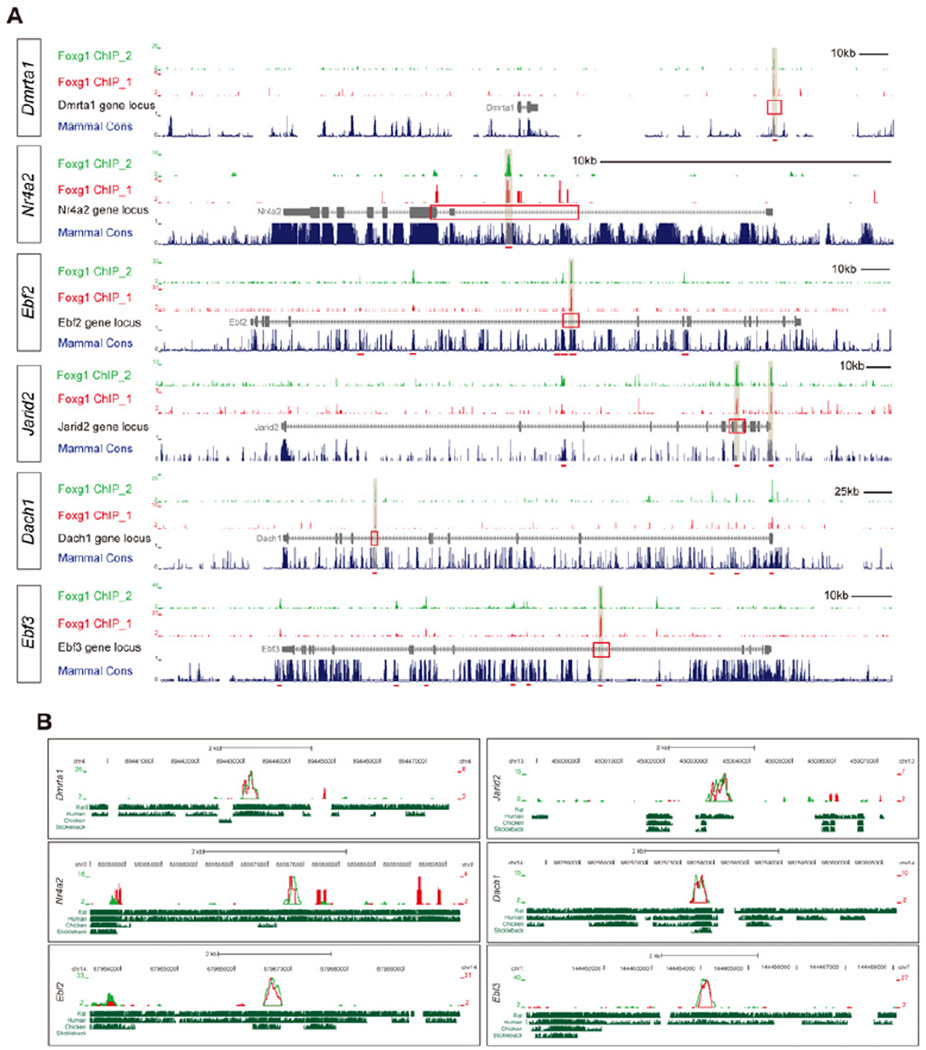
The specification of neuronal subtypes in the cerebral cortex proceeds in a temporal manner; however, the regulation of the transitions between the sequentially generated subtypes is poorly understood. Here, we report that the forkhead box transcription factor Foxg1 coordinates the production of neocortical projection neurons through the global repression of a default gene program. The delayed activation of Foxg1 was necessary and sufficient to induce deep-layer neurogenesis, followed by a sequential wave of upper-layer neurogenesis. A genome-wide analysis revealed that Foxg1 binds to mammalian-specific noncoding sequences to repress over 12 transcription factors expressed in early progenitors, including Ebf2/3, Dmrt3, Dmrta1, and Eya2. These findings reveal an unexpected prolonged competence of progenitors to initiate corticogenesis at a progressed stage during development and identify Foxg1 as a critical initiator of neocorticogenesis through spatiotemporal repression, a system that balances the production of nonradially and radially migrating glutamatergic subtypes during mammalian cortical expansion.


Figures

Figure 1
Figure 1. Temporal Competence of Cortical Progenitor Cells Upon Foxg1 Inactivation
(A–H) Coronal sections of E11.5 to E18.5 Foxg1+/− and Foxg1−/− cortices indicate expression of Reln (green), Ctip2 (red), and Brn2 (blue). vz, ventricular zone; ppl, preplate; cp, cortical plate; mz, marginal zone; iz, intermediate zone. (I and J) Migration of E14.5 pCAGGS-GFP-electroporated neurons in E18.5 Foxg1+/− and Foxg1−/−. (I′,J′) Enlarged views of the boxed regions in (I,J). (K) Schematic model of neurogenesis. The large circles indicate progenitors, and the small circles indicate post-mitotic neurons. The arrows indicate a transition in cell competence or neuronal differentiation. CR, Cajal-Retzius progenitors; DL, deep-layer progenitors; UL, upper-layer progenitors. (L and M) Foxg1 (red) and DAPI staining (blue) of E13.5 (L) and E15.5 (M) wild-type cortices. (N) Schematic diagram of the Foxg1tetOFoxg1 line. Foxg1 transgene expression is repressed in the presence of doxycycline (Dox). (O–V) Foxg1 and Reln expression in Foxg1tetOFoxg1 mice or Foxg1tTA/+ control littermates. Dox was administered at E13 or E15, and the embryos were harvested at E16.5 and E18.5, respectively. (W and X) Schematic diagram of temporal competence of cortical progenitors upon Foxg1 inactivation. UL progenitors do not acquire a CR cell fate upon Foxg1 inactivation (X). Whether these progenitors retain the UL cell identity is under investigation. KO, knockout. Scale bar: 100 µm. See also Figure S1.
Figure 2
Figure 2. DL Neurons are Produced After Prolonged CR Cell Production Upon Foxg1 Induction
(A) Models for the progression of temporal competence in the absence of Foxg1. (a) In this progressive intrinsic clock model, the repression of Foxg1 during the period of DL production does not affect the timing of UL neuron production. (b) According to this model, Foxg1 re-expression after prolonged inactivation initiates DL neurogenesis at E14.5. Each circle represents progenitor state. (B–Q) Foxg1 and Reln (B–M) and Ctip2 and DAPI (N and O) immunohistochemistry and Fezf2 in situ hybridization (P and Q) of coronal sections from Foxg1tTA/+ controls and Foxg1tetOFoxg1 [E9.5–14.5off] mice. (B–G) Dox was administered from E9.5 to E14.5, at which point the cortices were analyzed; (H–Q) Dox was administered from E9.5 to E14.5 and replaced with H2O from E14.5 to E18.5, at which point the cortices were analyzed. Scale bars: 100 µm (B-M); 50 µm (all others). (R) Experimental design and summary. (S–Y) In utero electroporation of pCAGGS-GFP (S–S''', U–U''',X) or pCAGGS-GFP and pCAGGS-Foxg1 (T–T''',V–V''',Y) into E14.5 Foxg1−/− cortex and analyzed at E18.5. (S'–V''') indicate enlarged views of the boxed regions shown in (S–V). See also Figures S2 and S3.
Figure 3
Figure 3. The Onset of Foxg1 Triggers Sequential DL and UL Neurogenesis
(A) Schematic diagram of the birthdating studies. (B–E) BrdU and Ctip2 (B and C) or Brn2 (D and E) immunohistochemistry in coronal sections of E18.5 Foxg1tetOFoxg1 [E9.5–14.5off] mice and Foxg1tTA/+ littermates. (B′–E′) Enlarged views of the boxed regions shown in (B–E). The arrowheads indicate cells that are double-labeled with Ctip2 and BrdU, or Brn2 and BrdU. Scale bars: 100 µm (B–E), 50 µm (B'–E'). (F) Quantitative analysis of the percentage of BrdU+ cells that expresses Ctip2 and Brn2. *P < 0.05 and **P < 0.01. (G–L) Ctip2 (red) and Zfpm2/Sox5 (merged in green) immunohistochemistry in E14.5, E16.5 and E18.5 Foxg1tetOFoxg1 [E9.5–14.5off] and Foxg1tTA/+ cortices. Scale bars: 50 µm (G–L''). (M,N) Quantitative analysis of DL cells expressing Ctip2, Zfpm2 and Sox5. The y-axes indicate the total number of neurons per unit area that expressed any of the three markers. Colored bars represent the relative proportion of Ctip2+ only (red), Zfpm2/Sox5-positive only (green) and Ctip2+ cells that also expressed Zpfm2/Sox5 (yellow) of total DL cells. (O–X) Double-detection of EdU and respective markers: UL neurons; Brn2, Satb2, Cux1 (O-T), mature neurons; NeuN (U,V), DL neurons; Ctip2, Zpfm2/Sox5 (W,X) in E18.5 Foxg1tetOFoxg1 [E9.5–14.5off] mice and Foxg1tTA/+ littermates. (O′–X′) Enlarged views of the boxed regions shown in (O–X). The arrowheads indicate cells that were double-labeled with the indicated markers and EdU. Scale bars: 100 µm (O–X), 50 µm (O'-X'). (Y) Quantitative analysis of the percentage of EdU+ cells that were co-labeled with the respective markers. **P < 0.01. (Z) Schematic diagram of neurogenesis upon Foxg1 expression. Cux1 and Brn2 are expressed in both progenitors and neurons, whereas the others are expressed in post-mitotic neurons. Zpfm2/Sox5 and Ctip2 are co-expressed in early post-mitotic neurons but are later differentially expressed in layers V and VI/SP neurons. The grey circle indicates potential glial progenitors. See also Figure S4.
Figure 4
Figure 4. Temporal Transcriptome Analysis of Foxg1-induced Cortical Progenitors In Vivo
(A) Experimental design. (B) Heatmap representing ANOVA cluster analysis. A total of six groups are indicated (groups I–VI). Datasets were obtained from two independent analyses of each experimental condition. E15.5 (Dox+) represents non-induced negative controls. Representative genes within each cluster are depicted on the right; blue indicates a previously reported Foxg1 target gene (Wnt8b), and red indicates reported CR cell markers. (C) Analysis of transcript response to Foxg1 induction. The response time (x axis) was calculated as the time required to reach a half-maximum response at E16.5 (inset). Response magnitude (y axis) is represented by fold change (log2). Red indicates transcription factors; green indicates Wnt8b. See also Tables S1 and S2.
Figure 5
Figure 5. ChIP-seq Analysis of Foxg1-repressed Gene Loci
(A) Views of entire gene loci for the indicated genes. The data are presented from two independent ChIP-seq analyses (Foxg1 ChIP_1 and Foxg1 ChIP_2). The genes are listed in order of response to Foxg1. The red underline indicates MACS peaks and the light-brown bars mark MACS peaks with highest fold enrichment within the indicated region. (B) Enlarged views of the red-boxed regions in (A) and conservation between mouse and rat, human, chicken, and stickleback. See also Table S3 and Figure S6.
Figure 6
Figure 6. Q-PCR and ISH Analysis of Foxg1-repressed Transcription Factors
(Left column) qPCR data of E14.5, E15.5, and E16.5 Foxg1tetOFoxg1 [E9.5–14.5off] cortical progenitors. The values are relative to GAPDH expression. (Right columns) The representative ISH images from E11.5 wild type (sagittal), E14.5 control, E14.5 and E16.5 Foxg1tetOFoxg1 [E9.5–14.5off] (coronal) cortices. The figures are shown in order of response to Foxg1 (early to late), with the exception of Wnt8b, which is a positive control. Scale bars: 100 µm (E14.5, E16.5); 200 µm (E11.5). See also Figures S5 and Table S4.
Figure 7
Figure 7. Proposed model for the switch in neurogenesis in the cerebral cortex
(A) Foxg1 (red) is induced in the anterior neural ectoderm through rostral Fgf8 expression (yellow) and expands caudally in the neural plate. (B) After neural tube closure, Foxg1 shifts the rostral limit of caudal telencephalic gene expression within the neuroepithelium (indicated in green) and initiates projection neuron production in the dorsal progenitors. Expression of these genes is only observed rostrally in migrating CR neurons. Note that the cortical hem corresponds only to the dorsal part of the CR cell competent region (green) in the sagittal section. Ventrally, the caudal limits of Foxg1 expression are the PSB and thalamic eminence (Pax6+ and Sfrp2+ region in Figure S7). PSB, pallium-subpallium boundary; CPe, choroid plexus; ThE, thalamic eminence. See also Figure S7.

References

    1. Ahlgren S, Vogt P, Bronner-Fraser M. Excess FoxG1 causes overgrowth of the neural tube. J. Neurobiol. 2003;57:337–349. - PubMed
    1. Alcamo E, Chirivella L, Dautzenberg M, Dobreva G, Farinas I, Grosschedl R, McConnell S. Satb2 regulates callosal projection neuron identity in the developing cerebral cortex. Neuron. 2008;57:364–377. - PubMed
    1. Angevine JB, Jr, Sidman RL. Autoradiographic study of cell migration during histogenesis of cerebral cortex in the mouse. Nature. 1961;192:766–768. - PubMed
    1. Arlotta P, Molyneaux B, Chen J, Inoue J, Kominami R, Macklis J. Neuronal subtype-specific genes that control corticospinal motor neuron development in vivo. Neuron. 2005;45:207–221. - PubMed
    1. Bielle F, Griveau A, Narboux-Neme N, Vigneau S, Sigrist M, Arber S, Wassef M, Pierani A. Multiple origins of Cajal-Retzius cells at the borders of the developing pallium. Nat. Neurosci. 2005;8:1002–1012. - PubMed

Publication types

MeSH terms

Substances

LinkOut - more resources