. 2013 Apr 25;50(2):212-22.
doi: 10.1016/j.molcel.2013.02.015. Epub 2013 Mar 21.

Signaling pathways differentially affect RNA polymerase II initiation, pausing, and elongation rate in cells

Affiliations

Signaling pathways differentially affect RNA polymerase II initiation, pausing, and elongation rate in cells

Charles G Danko et al. Mol Cell. .

Erratum in

  • Mol Cell. 2013 Jun 6;50(5):778

Abstract

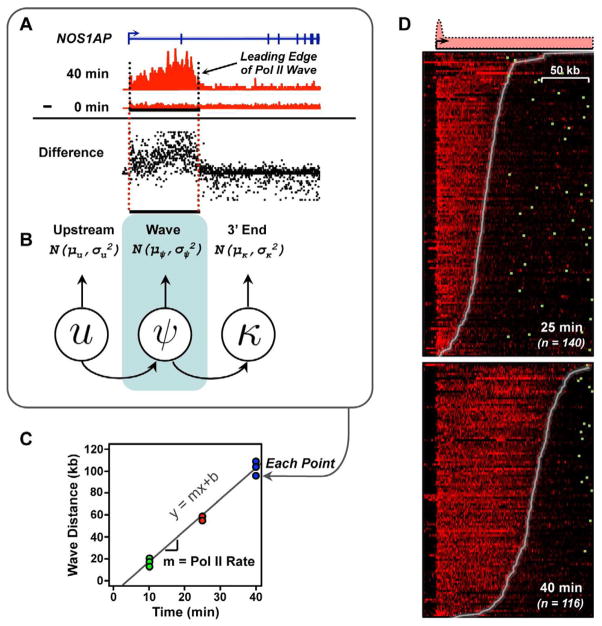
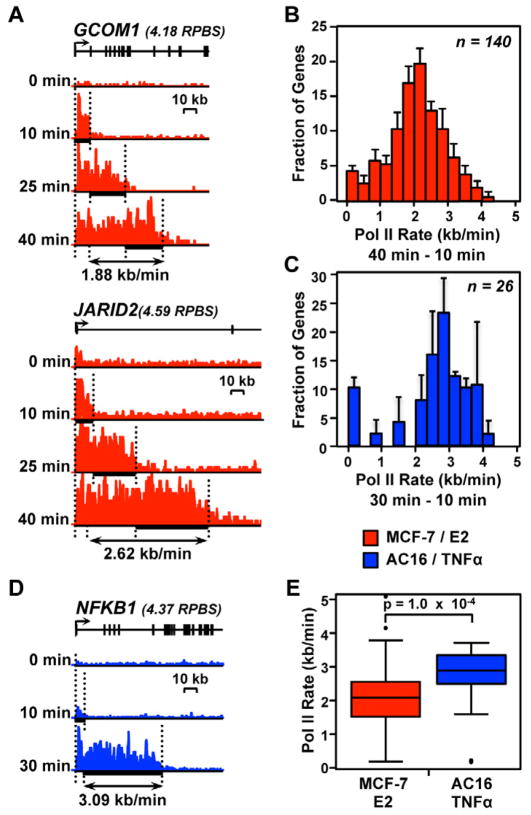
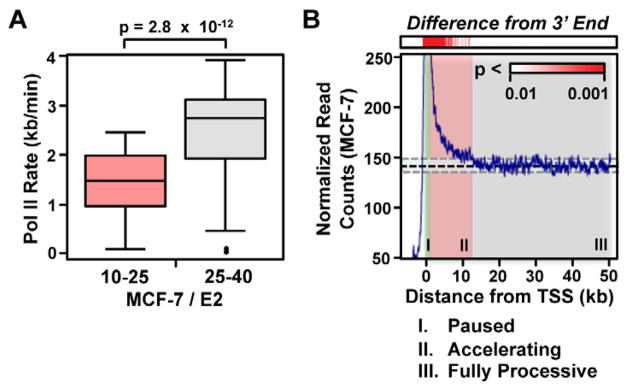
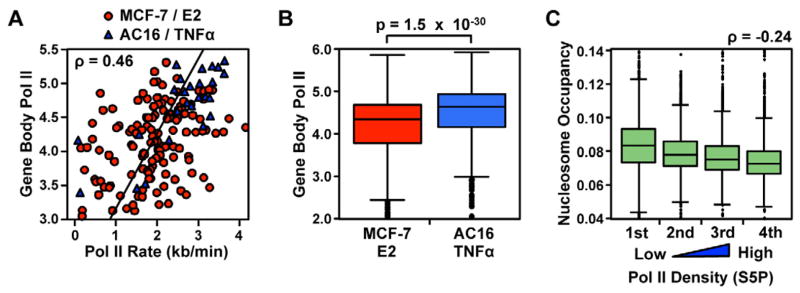
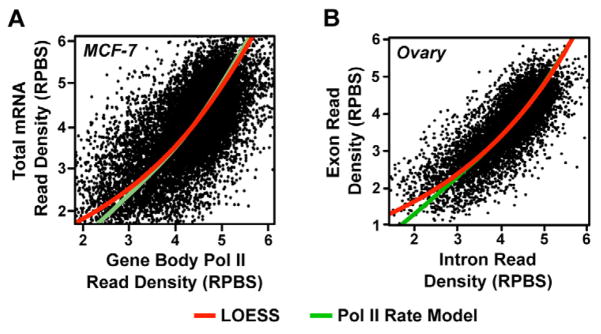
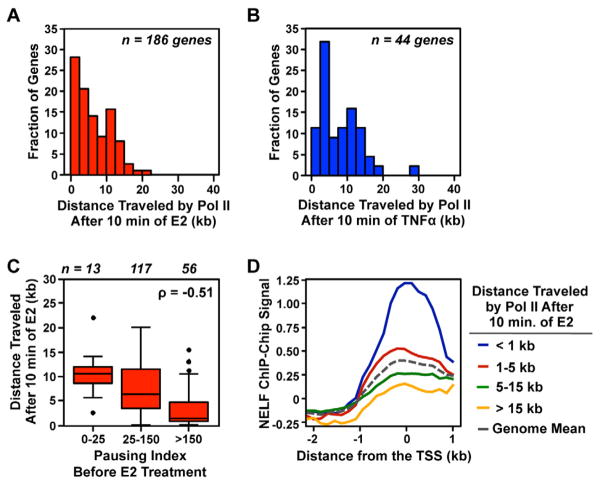
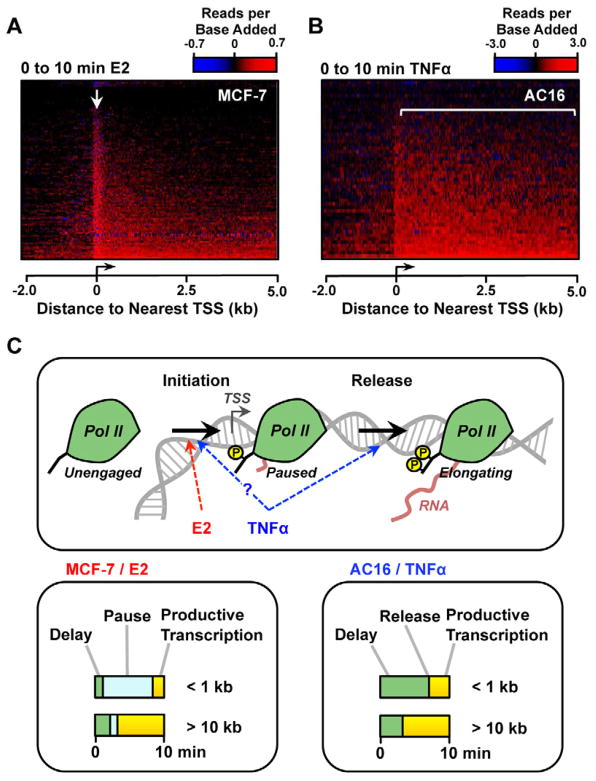
RNA polymerase II (Pol II) transcribes hundreds of kilobases of DNA, limiting the production of mRNAs and lncRNAs. We used global run-on sequencing (GRO-seq) to measure the rates of transcription by Pol II following gene activation. Elongation rates vary as much as 4-fold at different genomic loci and in response to two distinct cellular signaling pathways (i.e., 17β-estradiol [E2] and TNF-α). The rates are slowest near the promoter and increase during the first ~15 kb transcribed. Gene body elongation rates correlate with Pol II density, resulting in systematically higher rates of transcript production at genes with higher Pol II density. Pol II dynamics following short inductions indicate that E2 stimulates gene expression by increasing Pol II initiation, whereas TNF-α reduces Pol II residence time at pause sites. Collectively, our results identify previously uncharacterized variation in the rate of transcription and highlight elongation as an important, variable, and regulated rate-limiting step during transcription.


Figures

Figure 1
Figure 1. An approach for measuring rates of Pol II transcription using GRO-seq data
(A and B) The Pol II wave was identified in GRO-seq data using a three state HMM applied to difference maps in each biological replicate. (C) Pol II elongation rates were fit using linear regression. (D) GRO-seq difference maps in the 25 and 40 min. E2 treatment conditions, versus untreated MCF-7 cells. Genes are ordered using the Pol II wave distance in each time point. Different numbers of genes reflect waves traveling past the end of the gene following 40 min. of treatment. Genes are aligned on the transcription start site; polyadenylation sites are denoted by green boxes.
Figure 2
Figure 2. Pol II transcription rates vary across the genome and between different biological systems and inducers
(A and D) Pol II density following a time course of treatment with inducer. (A) Red, two genes responding to E2 treatment in MCF-7 cells. (B) Blue, a gene responding to TNFα treatment in AC16 cells. Different time points are shown at the same Y-axis scale for each gene. Y-axes vary between genes based on their expression level, which are shown in units of reads per base scaled (RPBS) above each gene. (B and C) Histograms of Pol II elongation rates for 140 genes in MCF-7 cells (B) or 26 genes in AC16 cells (C) for which high confidence elongation rates could be determined. Error bars represent standard error of the mean between biological replicates. (E) Comparison of elongation rates between MCF-7 and AC16 cells. The p-value was calculated using a two-sided Wilcoxon rank sum test.
Figure 3
Figure 3. Pol II accelerates into gene bodies
(A) Boxplots comparing elongation rates in the 10 to 25 and 25 to 40 min. windows. A two-sided Wilcoxon rank sum test was used to test significance. (B) Metagene analysis showing steady-state Pol II density in resting MCF-7 cells at genes longer than 50 kb (n = 3,384). The red scale (top) shows the p-value of each window relative to a standardized distribution in the region between 30 to 50 kb downstream of the transcription start site.
Figure 4
Figure 4. Elongation rates correlate with Pol II density
(A) Scatter plot showing Pol II rates as a function of gene expression levels, in RPBS. Red points show 140 genes in MCF-7 cells and blue points show 26 genes in AC16 cells. (B) Expression levels of E2 target genes in MCF-7 cells, compared with TNFα target genes in AC16 cells. Significance was tested using a two-sided Wilcoxon rank sum test. (C) Nucleosome occupancy in human T-cells, as determined by MNase digestion, presented in quartiles of gene expression level.
Figure 5
Figure 5. Variation in Pol II elongation rate impacts mRNA production
(A and B) Comparison of primary transcription using GRO-seq data (A) or intron reads from non-polyA selected mRNA-seq data (B) to mRNA levels in the indicated cell type. Red lines reflect the best fit using LOESS local regression. Green lines reflect the expected relationship, accounting for Pol II elongation rate variation.
Figure 6
Figure 6. Pausing influences Pol II wave distance following a 10 min. treatment with E2, but not TNFα
(A and B) Histograms show the distance travelled by Pol II following a 10 min. treatment with E2 (A) or TNFα (B). (C) The pausing index of untreated MCF-7 cells compared to the distance traveled by Pol II following a 10 min. treatment with E2. (D) Localization of NELF near the transcription start site of genes moving the distance indicated following 10 min. of E2.
Figure 7
Figure 7. Tracking the location of Pol II added following treatment with inducer suggests distinct modes for E2- and TNFα-dependent gene activation
(A and B) Heatmaps show the amount and location of Pol II recruited during the first 10 min. of treatment with either E2 (A, n =1,712) or TNFα (B, n =732). (C) Model depicting two distinct rate-limiting steps early in the transcription process (initiation and release from pause). At E2 target genes, newly recruited Pol II is associated with high residence times at the pause site (bottom, left), supporting a model in which E2 stimulates transcription by increasing the rate of initiation, or earlier rate-limiting steps. Pol II recruited by TNFα is not associated with a transient pause (bottom, right), suggesting that TNFα increases transcription efficiency through the pause site.

Comment in

Similar articles

Cited by

References

    1. Ardehali MB, Lis JT. Tracking rates of transcription and splicing in vivo. Nat Struct Mol Biol. 2009;16:1123–1124. - PubMed
    1. Barboric M, Nissen RM, Kanazawa S, Jabrane-Ferrat N, Peterlin BM. NF-kappaB binds P-TEFb to stimulate transcriptional elongation by RNA polymerase II. Mol Cell. 2001;8:327–337. - PubMed
    1. Barski A, Cuddapah S, Cui K, Roh TY, Schones DE, Wang Z, Wei G, Chepelev I, Zhao K. High-resolution profiling of histone methylations in the human genome. Cell. 2007;129:823–837. - PubMed
    1. Belotserkovskaya R, Oh S, Bondarenko VA, Orphanides G, Studitsky VM, Reinberg D. FACT facilitates transcription-dependent nucleosome alteration. Science. 2003;301:1090–1093. - PubMed
    1. Boettiger AN, Levine M. Synchronous and stochastic patterns of gene activation in the Drosophila embryo. Science. 2009;325:471–473. - PMC - PubMed

Publication types

MeSH terms

Associated data