. 2013 Jun;34(19):4643-54.
doi: 10.1016/j.biomaterials.2013.02.063. Epub 2013 Mar 22.

Photosensitizer-conjugated silica-coated gold nanoclusters for fluorescence imaging-guided photodynamic therapy

Affiliations

Photosensitizer-conjugated silica-coated gold nanoclusters for fluorescence imaging-guided photodynamic therapy

Peng Huang et al. Biomaterials. 2013 Jun.

Abstract

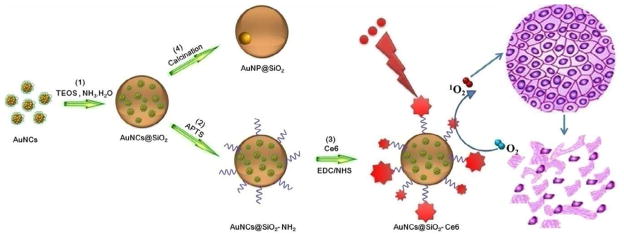
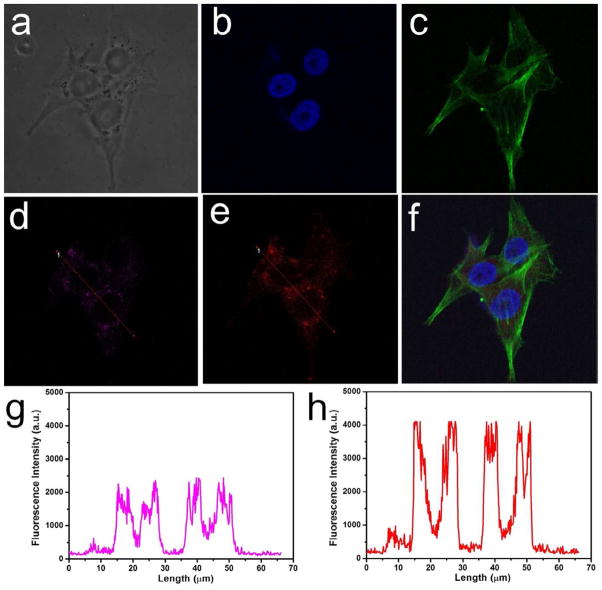
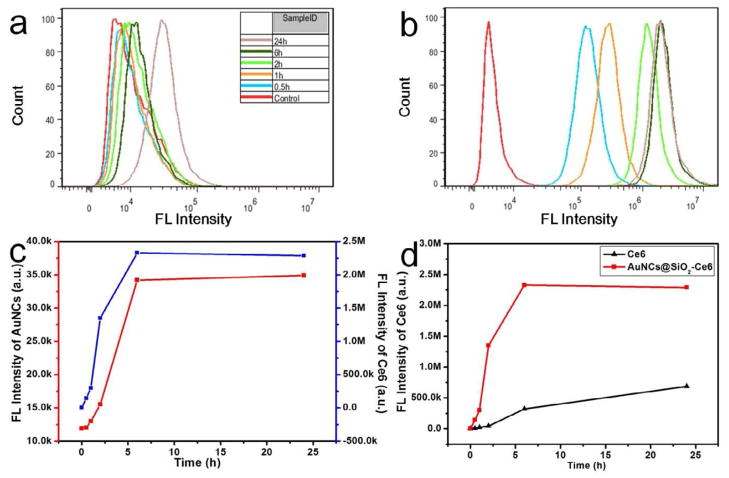
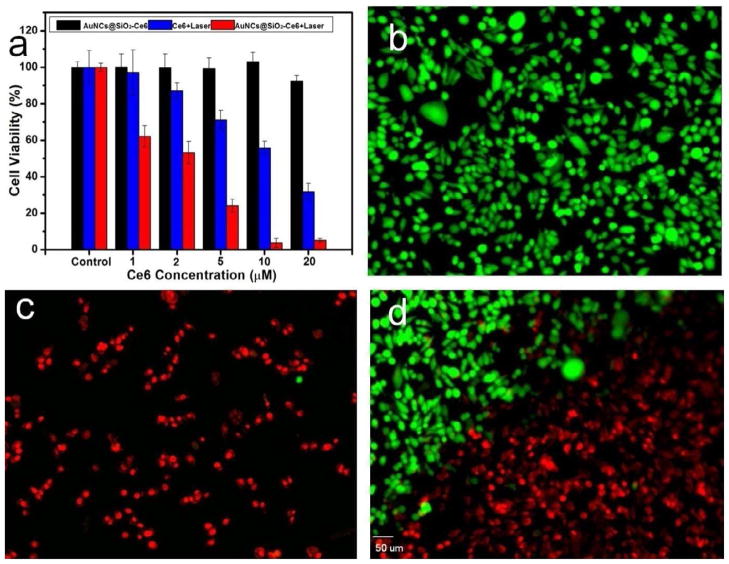
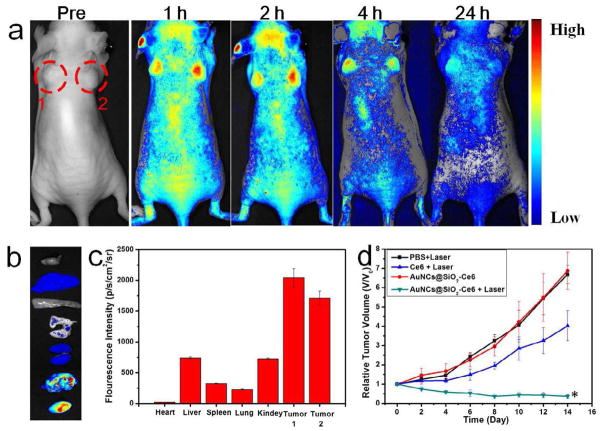
Multifunctional theranostics have recently been intensively explored to optimize the efficacy and safety of therapeutic regimens. In this work, a photo-theranostic agent based on chlorin e6 (Ce6) photosensitizer-conjugated silica-coated gold nanoclusters (AuNCs@SiO2-Ce6) is strategically designed and prepared for fluorescence imaging-guided photodynamic therapy (PDT). The AuNCs@SiO2-Ce6 shows the following features: i) high Ce6 photosensitizer loading; ii) no non-specific release of Ce6 during its circulation; iii) significantly enhanced cellular uptake efficiency of Ce6, offering a remarkably improved photodynamic therapeutic efficacy compared to free Ce6; iv) subcellular characterization of the nanoformula via both the fluorescence of Ce6 and plasmon luminescence of AuNCs; v) fluorescence imaging-guided photodynamic therapy (PDT). This photo-theranostics owns good stability, high water dispersibility and solubility, non-cytotoxicity, and good biocompatibility, thus facilitating its biomedical applications, particularly for multi-modal optical, CT and photoacoustic (PA) imaging-guided PDT or sonodynamic therapy.


Figures

Figure 1
Figure 1
Illustration of the synthetic procedure of Ce6-conjugated silica-coated gold nanoclusters (AuNCs@SiO2-Ce6) for photodynamic therapy and the calcination of AuNCs@SiO2 into AuNP@SiO2. (1) AuNCs were coated by a silica layer to form a fluorescent core-shell nanostructure using a modified Stöber method. (2) A silane coupling agent, 3-aminopropyltrimethoxysilane (APTS), was used to modify the silica surface for further conjugation. (3) Covalent binding of Ce6 to the AuNCs@SiO2-NH2 was performed using a modified EDC-NHS reaction. (4) AuNCs@SiO2 was calcined at 600 °C for 2 h to fuse into GNP@SiO2.
Figure 2
Figure 2
TEM images of (a, b) AuNCs@SiO2, (c, d) AuNP@SiO2, and (e, f) AuNCs@SiO2-Ce6. (a, c, e) are at low magnification and (b, d, f) are at high magnification. White arrows point at the AuNPs.
Figure 3
Figure 3
a) The photographs of AuNCs@SiO2, GNPs@SiO2, and AuNCs@SiO2-Ce6 in eppendorf vials after centrifugation. b) The photographs of AuNCs@SiO2-Ce6 in different solutions such as ultrapure water (UPW), deionized water (DI), PBS buffer (pH 7.4) and cell medium). c) UV-vis absorbance spectra of AuNCs@SiO2, pure Ce6, and AuNCs@SiO2-Ce6. d) Fluorescence emission spectra of AuNCs@SiO2-Ce6 at different excitation wavelengths (360, 400, and 470 nm). e) Zeta potentials of AuNCs@SiO2, AuNCs@SiO2-NH2, and AuNCs@SiO2-Ce6.
Figure 4
Figure 4
a) Time-dependent bleaching of SOSG and AuNCs@SiO2-Ce6 caused by the singlet oxygen (SO) generated by AuNCs@SiO2-Ce6. b) The changes of optical density at various peaks (404 and 646 nm) as the function of laser irradiation time. c) Fluorescence emission spectra of AuNCs@SiO2-Ce6 in SOSG solution with the increase of the laser irradiation time. d) The changes of fluorescence intensity at the characteristic peaks of SOSG (528 nm) and Ce6 (662 nm) as a function of laser irradiation time. The concentration of Ce6 in AuNCs@SiO2-Ce6 is fixed at 0.5 μM. The mixture solutions were irradiated with a 671 nm laser (200 mW/cm2). SOSG was dissolved in water containing 2% methanol with the final concentration of 1 μM. SOSG fluorescence emission was produced using an excitation wavelength of 494 nm.
Figure 5
Figure 5
Subcellular colocalization of AuNCs@SiO2-Ce6, monitored by fluorescence imaging. MDA-MB-435 cell line was incubated with AuNCs@SiO2-Ce6 at a concentration of 10 μM for 2 h at 37 °C. a) Bright field. b-f) Fluorescence field, b) Nuclei of MDA-MB-435 cells stained by DAPI. c) F-actin of MDA-MB-435 cells stained by Alex 488. d) AuNCs of AuNCs@SiO2-Ce6 in MDA-MB-435 cells, e) Ce6 of AuNCs@SiO2-Ce6 in MDA-MB-435 cells, f) Merged image of b, c and e. g) Fluorescence intensity and location of AuNCs in MDA-MB-435 cells, h) Fluorescence intensity and location of Ce6 in MDA-MB-435 cells.
Figure 6
Figure 6
Fluorescence-activated cell sorting (FACS) distribution of AuNCs and Ce6 fluorescence in MDA-MB-435 cells after 0.5, 1, 2, 6, and 24 h incubation with AuNCs@SiO2-Ce6 (10 μM) at 37 °C. a) Fluorescence intensity of AuNCs in MDA-MB-435 cells. b) Fluorescence intensity of Ce6 in MDA-MB-435 cells. c) The changes of fluorescence intensity of AuNCs and Ce6 in MDA-MB-435 cells as a function of incubation time. d) The changes of Ce6 fluorescence intensity in MDA-MB-435 cells as a function of incubation time.
Figure 7
Figure 7
a) MDA-MB-435 cell viability at different concentrations of free Ce6 and AuNCs@SiO2-Ce6 for 12 h at 37 °C with or without irradiation with a 671 nm laser (2 W/cm2). b-d) Calcein AM and ethidium homodimer-1 co-staining images of MDA-MB-435 cells incubated with AuNCs@SiO2-Ce6 at a concentration of 10 μM for 2 h at 37 °C prior to irradiation for 1 min with a 671 nm laser (2 W/cm2). b) MDA-MB-435 cells without irradiation. c) MDA-MB-435 cells with irradiation. d) MDA-MB-435 cells on the boundary of laser spot. The scale bar is 50 μm.
Figure 8
Figure 8
a) Real-time in vivo NIR fluorescence images after intravenous injection of AuNCs@SiO2-Ce6 in nude mice at different time points, Red circles indicate the location of tumors; b) Ex vivo images of mouse tissues (from top to bottom: heart, liver, spleen, lung, kidneys, tumor 1, tumor 2); c) The fluorescence intensity of organs harvested at 24 h time point from post-injection mice; d) Tumor growth curves of different groups of tumor-bearing mice after treatment. Tumor volumes were normalized to their initial sizes. Error bars represent the standard deviations of 5 mice per group. *, P < 0.05.

References

    1. Lovell J, Jin C, Huynh E, Jin H, Kim C, Rubinstein J, et al. Porphysome nanovesicles generated by porphyrin bilayers for use as multimodal biophotonic contrast agents. Nat Mater. 2011;20:324–32. - PubMed
    1. Lovell J, Liu T, Chen J, Zheng G. Activatable photosensitizers for imaging and therapy. Chem Rev. 2010;110:2839–57. - PubMed
    1. Rai P, Mallidi S, Zheng X, Rahmanzadeh R, Mir Y, Elrington S, et al. Development and applications of photo-triggered theranostic agents. Adv Drug Deliver Rev. 2010;62:1094–124. - PMC - PubMed
    1. Fleige E, Quadir M, Haag R. Stimuli-Responsive Polymeric nanocarriers for the controlled transport of active compounds: Concepts and applications. Adv Drug Deliver Rev. 2012;64:866–84. - PubMed
    1. Park K, Lee S, Kang E, Kim K, Choi K, Kwon IC. New generation of multifunctional nanoparticles for cancer imaging and therapy. Adv Funct Mater. 2009;19:1553–66.

Publication types

MeSH terms