. 2013 Jul;145(1):221-231.
doi: 10.1053/j.gastro.2013.03.013. Epub 2013 Mar 19.

Modeling pathogenesis of primary liver cancer in lineage-specific mouse cell types

Affiliations

Modeling pathogenesis of primary liver cancer in lineage-specific mouse cell types

Ágnes Holczbauer et al. Gastroenterology. 2013 Jul.

Abstract

Background & aims: Human primary liver cancer is classified into biologically distinct subgroups based on cellular origin. Liver cancer stem cells (CSCs) have been recently described. We investigated the ability of distinct lineages of hepatic cells to become liver CSCs and the phenotypic and genetic heterogeneity of primary liver cancer.

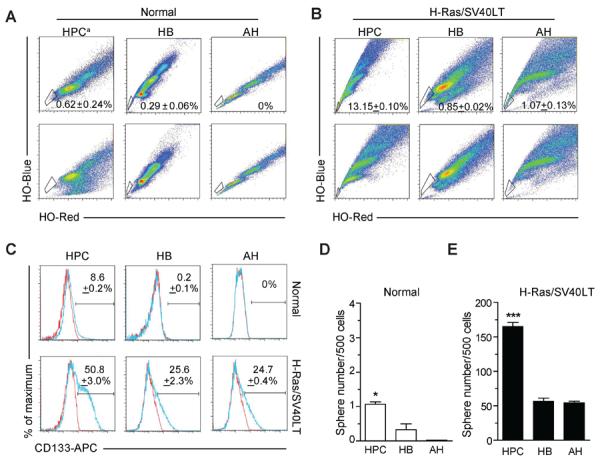
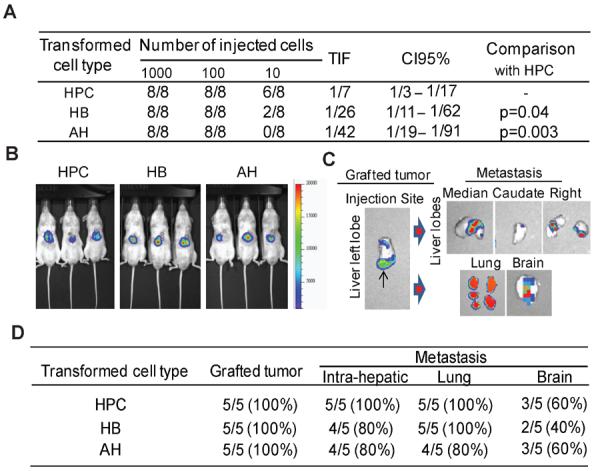
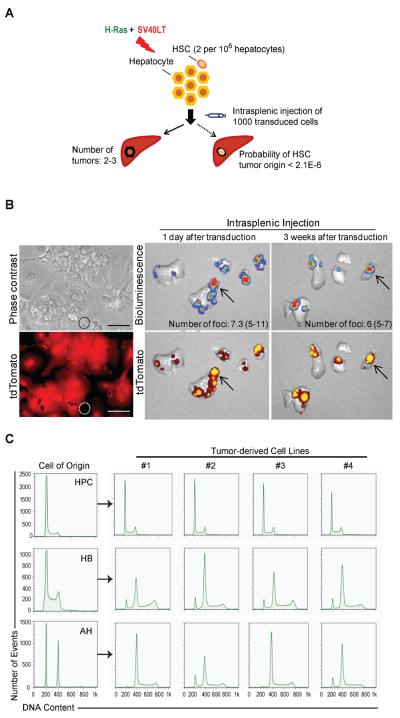
Methods: We transduced mouse primary hepatic progenitor cells, lineage-committed hepatoblasts, and differentiated adult hepatocytes with transgenes encoding oncogenic H-Ras and SV40LT. The CSC properties of transduced cells and their ability to form tumors were tested by standard in vitro and in vivo assays and transcriptome profiling.

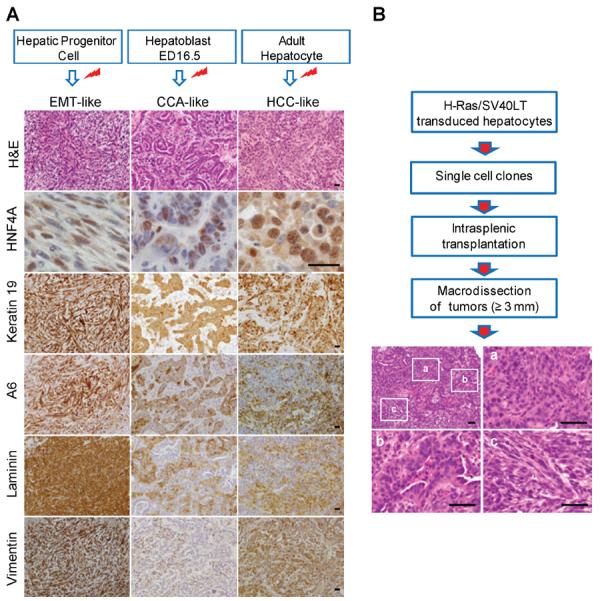
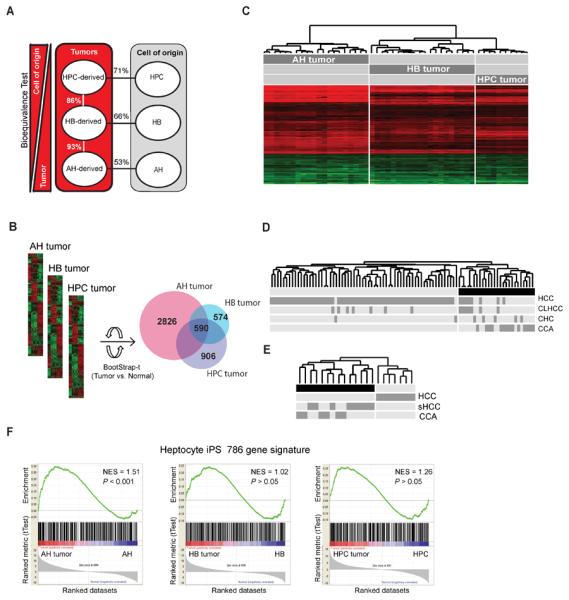
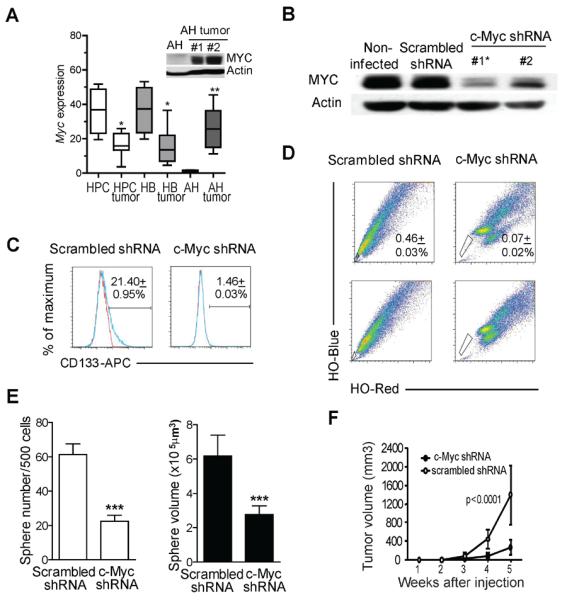
Results: Irrespective of origin, all transduced cells acquired markers of CSC/progenitor cells, side populations, and self-renewal capacity in vitro. They also formed a broad spectrum of liver tumors, ranging from cholangiocarcinoma to hepatocellular carcinoma, which resembled human liver tumors, based on genomic and histologic analyses. The tumor cells coexpressed hepatocyte (hepatocyte nuclear factor 4α), progenitor/biliary (keratin 19, epithelial cell adhesion molecule, A6), and mesenchymal (vimentin) markers and showed dysregulation of genes that control the epithelial-mesenchymal transition. Gene expression analyses could distinguish tumors of different cellular origin, indicating the contribution of lineage stage-dependent genetic changes to malignant transformation. Activation of c-Myc and its target genes was required to reprogram adult hepatocytes into CSCs and for tumors to develop. Stable knockdown of c-Myc in transformed adult hepatocytes reduced their CSC properties in vitro and suppressed growth of tumors in immunodeficient mice.

Conclusions: Any cell type in the mouse hepatic lineage can undergo oncogenic reprogramming into a CSC by activating different cell type-specific pathways. Identification of common and cell of origin-specific phenotypic and genetic changes could provide new therapeutic targets for liver cancer.


Figures

Figure 1
Figure 1
H-Ras/SV40LT-transduced HPCs, HBs and AHs acquire cancer stem cell properties in vitro. (A and B) Analysis of side population (SP) by flow cytometry in freshly isolated normal (A) and transduced (B) hepatic lineage cells. SP cells were identified by Hoechst 33342 (HO) staining. Fumitremorgin was used to set up the SP gate (FACS plots at the bottom). HPC: hepatic progenitor cell; HB: hepatoblast; AH: adult hepatocyte; a cultured HPCs at passage 5. Numbers represent mean ± SD of three experiments. (C) Analysis of CD133 expression by flow cytometry. Blue line: CD133-APC; red line: isotype control. Numbers represent mean ± SD of three experiments. (D–E) Spheroid forming ability. Freshly isolated normal (D) and transduced (E) hepatic lineage cells were cultured at low density in 1% methylcellulose. Sphere number was quantified after 7 days. Data represent mean ± SD of four experiments. Significant differences were evaluated by ANOVA and Poisson GLM. * P < 0.05; *** P < 0.001.
Figure 2
Figure 2
H-Ras/SV40LT-transduced HPCs, HBs and AHs give rise to fast growing tumors in two models of transplantation. (A) Limiting dilution analysis. H-Ras-Luciferase/EGFP and SV40LT-mCherry double positive cells were FACS sorted and injected subcutaneously in lower flanks of NOD/SCID mice. The frequency of tumor initiating cells (TIF) and confidence interval (CI95%) were calculated based on the number of resulting tumors/injection after 5 weeks. (BD) Orthotopic tumor growth and metastatic ability. (B) Representative bioluminescence images of mice at 11 days after transplantation of 150,000 cells of each type. (C) Ex vivo bioluminescence imaging of liver, lung and brain 16 days after transplantation. (D) Incidence of primary grafted tumors and intrahepatic, lung and brain metastases.
Figure 3
Figure 3
Tumors are derived from transformed AHs but not from HSCs. (A) Schematic overview of the approach used to compare the number of resulting tumors with the estimated frequency of hepatic stem cells (HSCs). Primary AH culture was transduced and cultured for only 1 day to exclude the possibility of selective overgrowth of HSCs. One thousand transduced cells were injected via spleen into NOD/SCID mice and liver tumors were counted after 18 days. Probability of tumor initiation by transduced HSCs was calculated using binomial distribution. (B) Left panel: phase contrast and fluorescence images of 24-hour primary hepatocyte culture established from Rosa26-CAG-stop-tdTomato mouse one week after i.v. injection of Ad-Cre virus. Dotted circle marks tdTomato-negative non-parenchymal cells. Scale bar: 100 μm. Right panel: Ex vivo bioluminescence and fluorescence images of livers 18 days after injection of 105 hepatocytes co-transduced with H-Ras/SV40LT and cultured for 1 or 21 days prior to intrasplenic transplanatation. (C) Flow cytometry analysis of DNA content in tumor cell lines (#1–4) established from liver tumors initiated by H-Ras/SV40LT-transduced HPCs, HBs and AHs.
Figure 4
Figure 4
(A) Representative H&E images and immunostaining of HCC-, CCA- and EMT-like tumor phenotypes. Paraffin-embedded sections were counterstained with haematoxilin. Red marks indicate transduction with H-Ras/SV40LT. EMT: epithelial-mesenchymal transition; CCA: cholangiocarcinoma; HCC: hepatocellular carcinoma; H&E: hematoxylin-eosin; HNF4A: hepatocyte nuclear factor 4 alpha. Scale bar: 25 μm. (B) Schematic overview of the approach and representative H&E staining of 1/42 tumors derived from a single cell clone of HRas/SV40LT-transduced AHs. Letters a, b, and c denote HCC-, CCA- and EMT-like areas within the same tumor shown. Scale bar: 50 μm.
Figure 5
Figure 5
Transcriptomic characteristics of liver tumors derived from distinct hepatic lineage cells. (A) Bioequivalence test of similarities between HPC-, HB- and AH-derived tumors and their respective cell-of-origin. Data were evaluated at fold change >1.5 and P < 0.05. (B) Venn diagram of differentially expressed genes in HPC, HB and AH tumors after normalization to corresponding normal cells. Bootstrap-t test: P < 0.001; fold change (C) Supervised hierarchical clustering of tumors based on 590 commonly differentially expressed genes. (D and E) Hierarchical clustering of human PLC data sets including HCC, CCA, CCA-like HCC (CLHCC), combined hepatocellular-cholangiocarcinoma (CHC) and scirrhous HCC (sHCC) from Woo et al. (D) and Seok et al. (E) using murine to human homologue genes comprised within the 590-gene common gene signature. (F) Gene set enrichment analysis using a hepatocyte iPSC gene signature (786 genes). iPSC: induced pluripotent stem cell; NES: normalized enrichment score, P < 0.05 was considered significant.
Figure 6
Figure 6
Myc is required for oncogenic reprogramming of AHs. (A) Box-plot analysis of Myc expression in HPC, HB and AH tumors and their normal counterparts based on microarray data. Significant differences were calculated by Mann-Whitney test. *P < 0.05; **P < 0.01. Inset: western blot analysis of c-Myc and actin in AHs and AH tumors. (B) Western blot analysis of c-Myc protein in H-Ras/SV40LT-transduced AHs infected with c-Myc shRNA or scrambled shRNA retroviruses. Actin was used as loading control. Asterisk marks the clone used for functional assays. (C) Analysis of CD133 expression by flow cytometry. Blue line: CD133-APC; red line: isotype control. Numbers show the mean ± SD of three experiments. (D) FACS analysis of side population identified by Hoechst 33342 (HO) staining. Numbers show the mean ± SD of three experiments. (E) Effects of c-Myc knockdown on spheroid forming ability. Cells expressing c-Myc shRNA or scrambled shRNA were seeded at low density in ultra-low attachment 96-well plates in 1% methylcellulose. Spheroids were counted after 7 days. White bars: sphere number; black bars: sphere volume. Data represent the mean ± SD of four experiments. Significant differences were evaluated by Poisson GLM and Student's t-test. *** P < 0.001. (F) Effects of c-Myc knockdown on tumor growth. One hundred cells expressing c-Myc shRNA or scrambled shRNA were injected in lower flanks of NOD/SCID mice (n=5 for each cell type). Graph shows the kinetics of subcutaneous tumor growth. Significant differences were evaluated by Student's t-test.

Comment in

References

    1. Visvader JE. Cells of origin in cancer. Nature. 2011;469:314–22. - PubMed
    1. Ince TA, Richardson AL, Bell GW, et al. Transformation of different human breast epithelial cell types leads to distinct tumor phenotypes. Cancer Cell. 2007;12:160–70. - PubMed
    1. Sutherland KD, Proost N, Brouns I, et al. Cell of origin of small cell lung cancer: inactivation of Trp53 and Rb1 in distinct cell types of adult mouse lung. Cancer Cell. 2011;19:754–64. - PubMed
    1. Nault JC, Zucman-Rossi J. Genetics of hepatobiliary carcinogenesis. Semin Liver Dis. 2011;31:173–87. - PubMed
    1. Yeh MM. Pathology of combined hepatocellular-cholangiocarcinoma. J Gastroenterol Hepatol. 2010;25:1485–92. - PubMed

Publication types

Substances