. 2013 Aug 1:76:313-24.
doi: 10.1016/j.neuroimage.2013.03.024. Epub 2013 Mar 21.

Spatially constrained hierarchical parcellation of the brain with resting-state fMRI

Affiliations

Spatially constrained hierarchical parcellation of the brain with resting-state fMRI

Thomas Blumensath et al. Neuroimage. .

Abstract

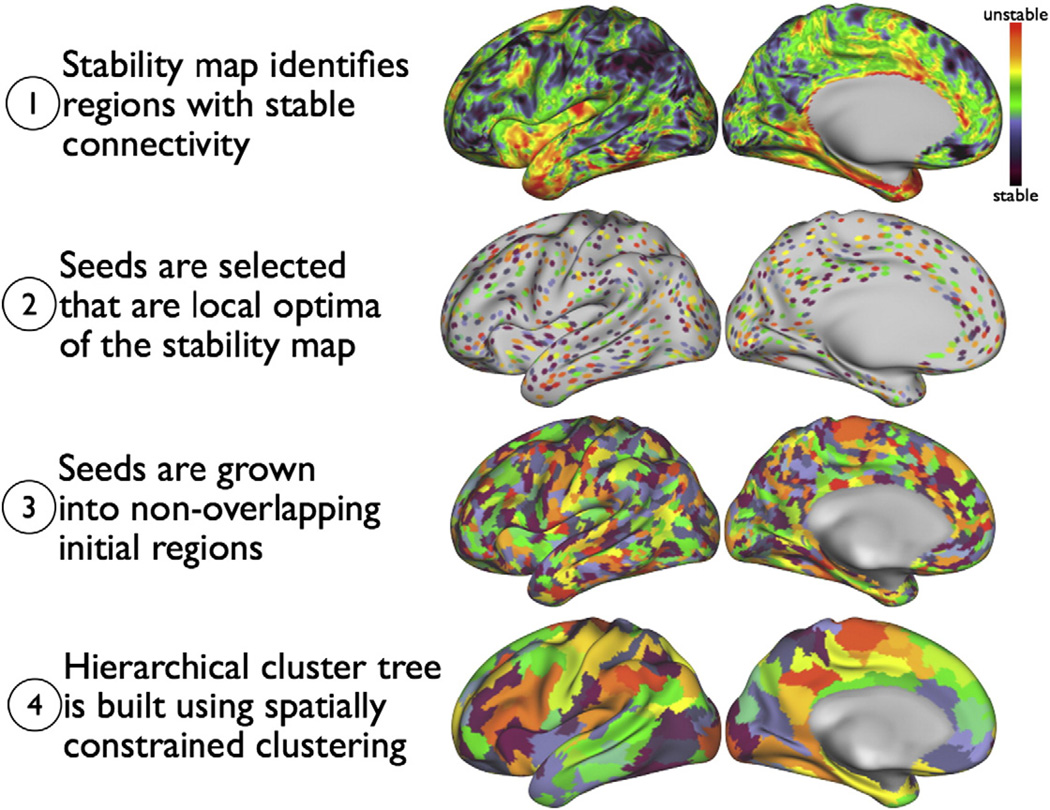
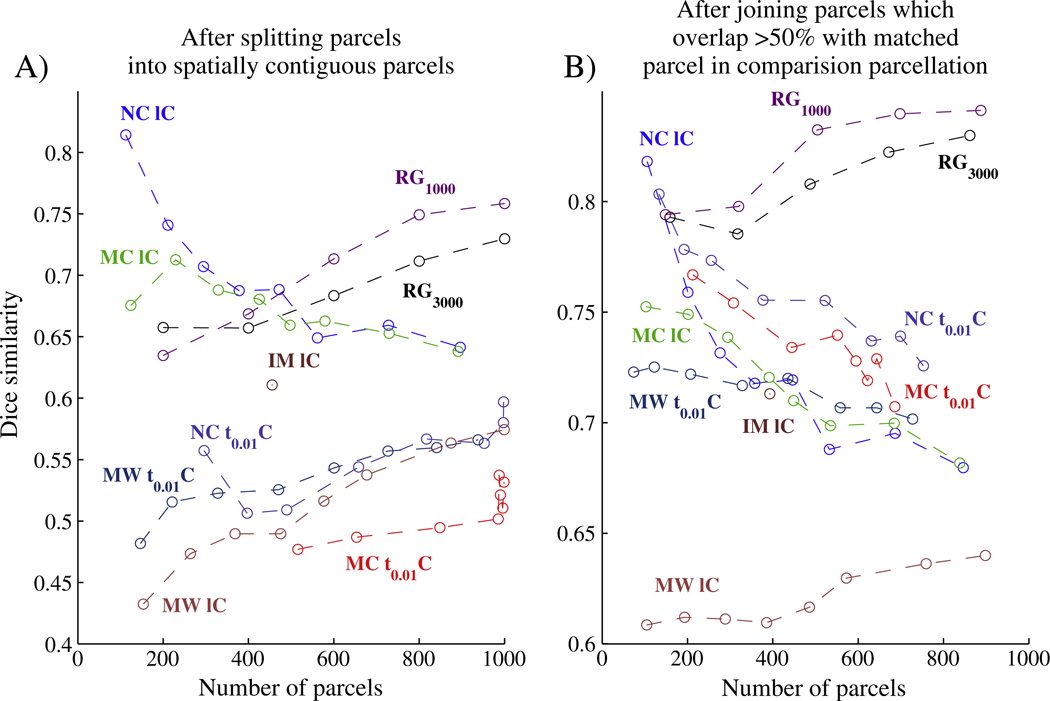
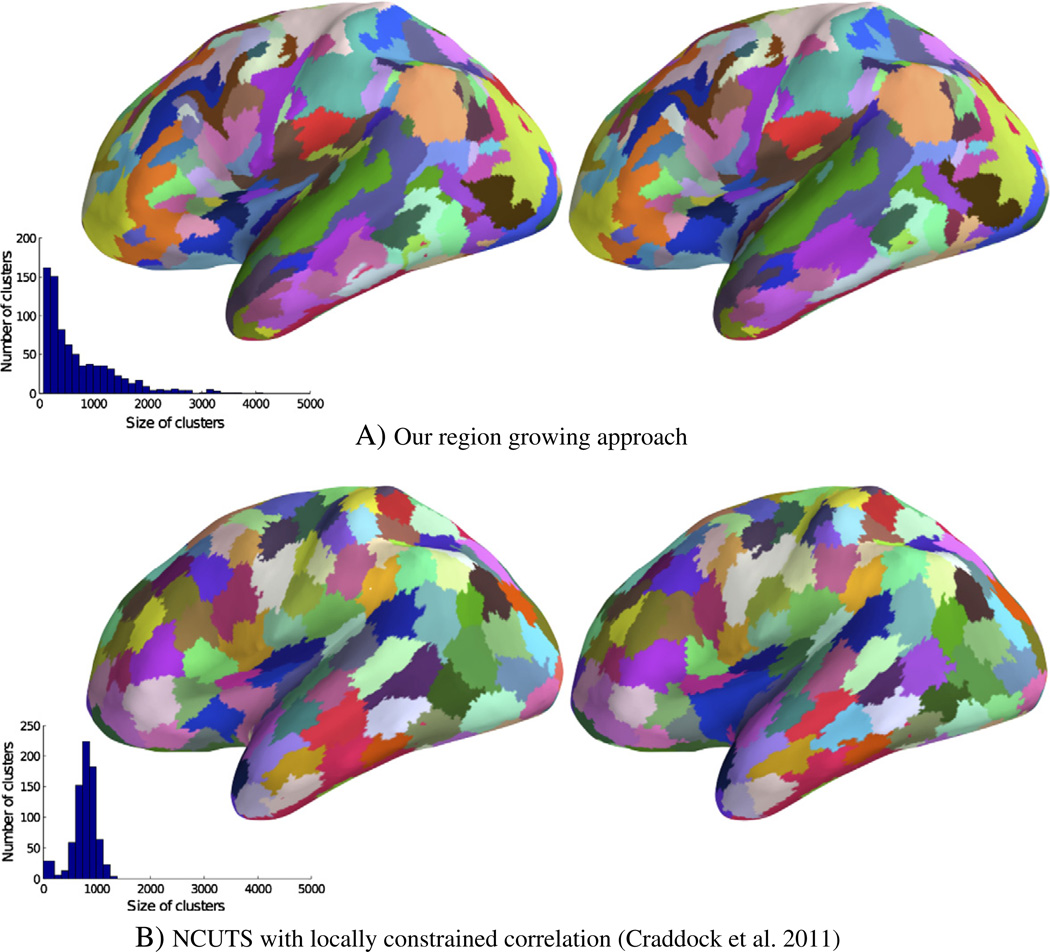
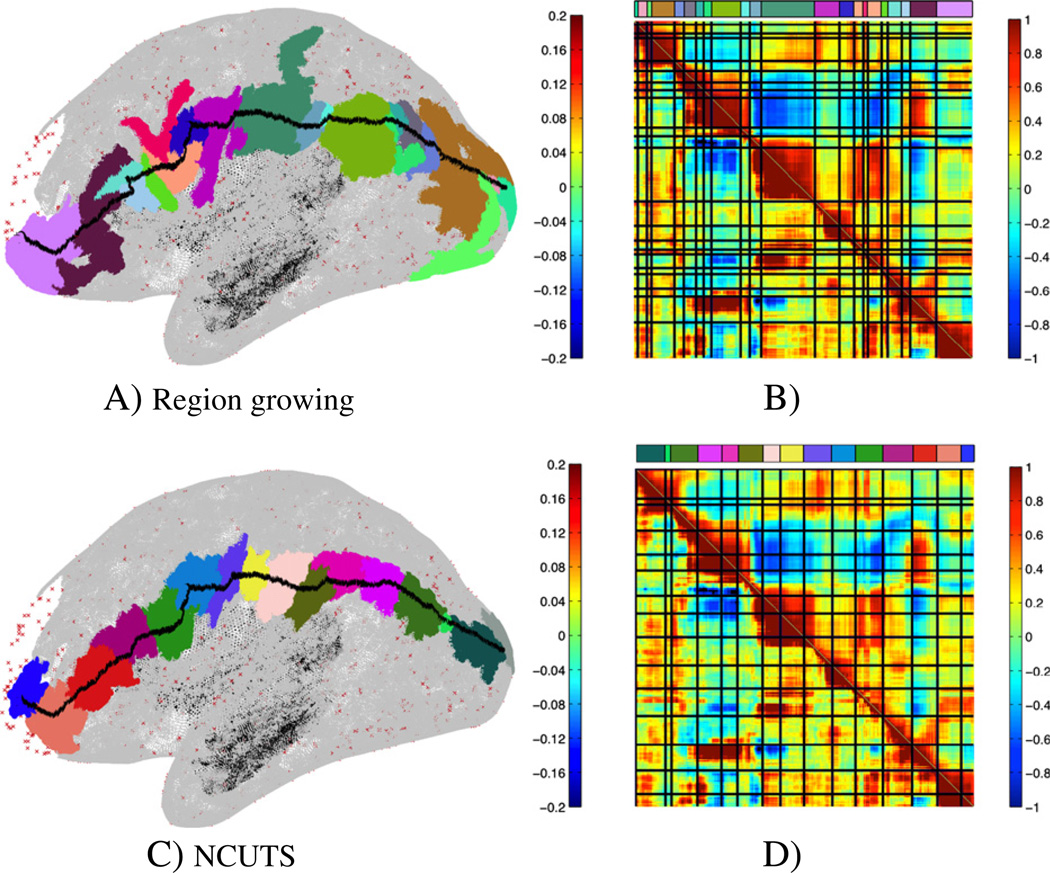
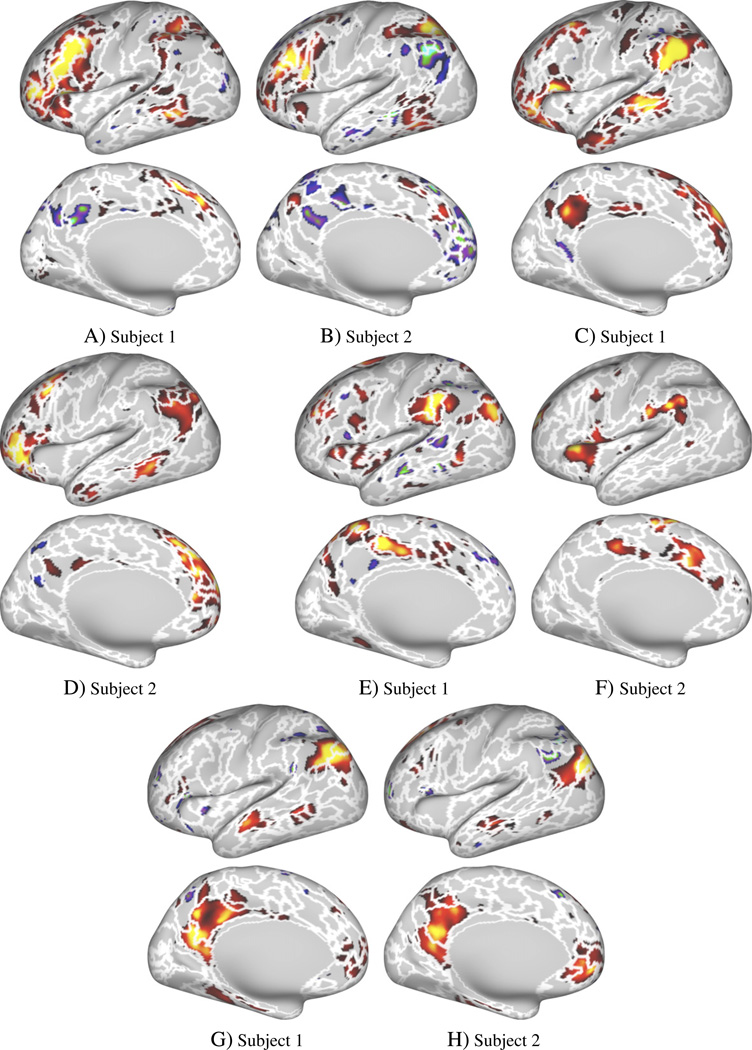
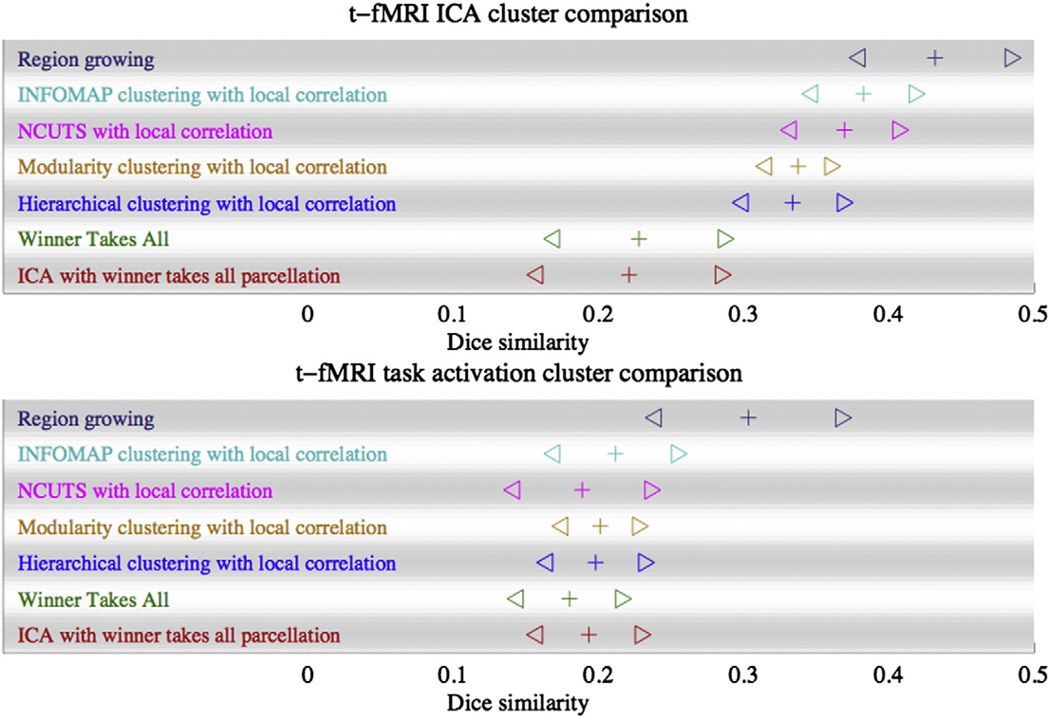
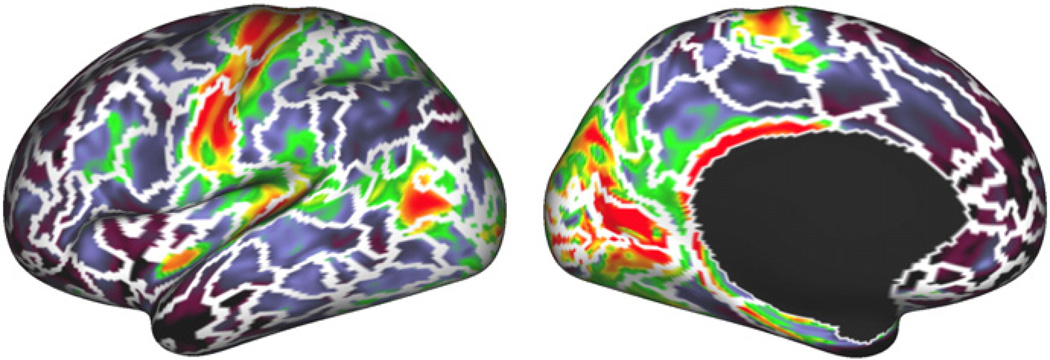
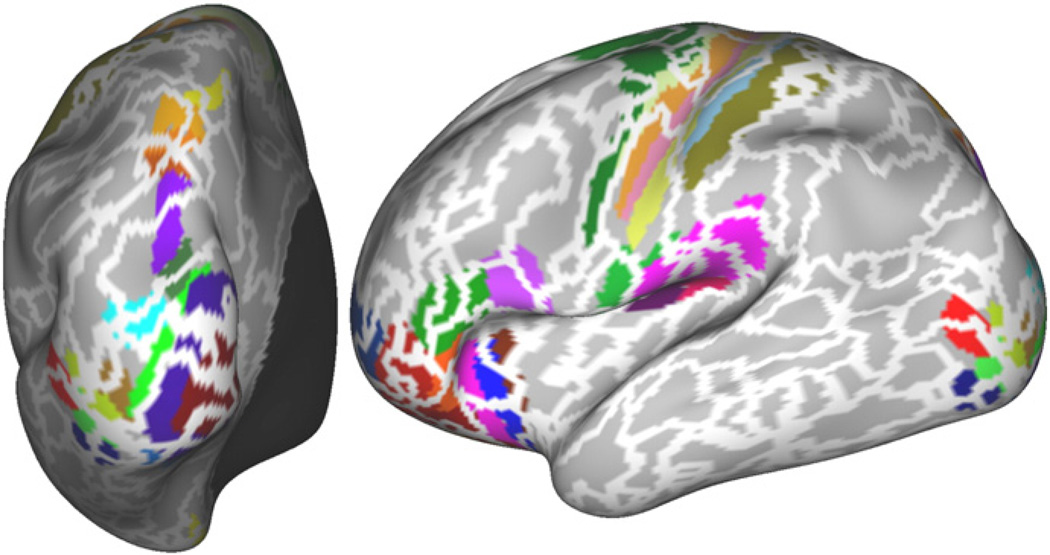
We propose a novel computational strategy to partition the cerebral cortex into disjoint, spatially contiguous and functionally homogeneous parcels. The approach exploits spatial dependency in the fluctuations observed with functional Magnetic Resonance Imaging (fMRI) during rest. Single subject parcellations are derived in a two stage procedure in which a set of (~1000 to 5000) stable seeds is grown into an initial detailed parcellation. This parcellation is then further clustered using a hierarchical approach that enforces spatial contiguity of the parcels. A major challenge is the objective evaluation and comparison of different parcellation strategies; here, we use a range of different measures. Our single subject approach allows a subject-specific parcellation of the cortex, which shows high scan-to-scan reproducibility and whose borders delineate clear changes in functional connectivity. Another important measure, on which our approach performs well, is the overlap of parcels with task fMRI derived clusters. Connectivity-derived parcellation borders are less well matched to borders derived from cortical myelination and from cytoarchitectonic atlases, but this may reflect inherent differences in the data.


Conflict of interest statement

Conflict of interest

The authors declare no conflicts of interest.

Figures

Fig. 1
Fig. 1
After preprocessing, clustering proceeds in four steps. In step (1) a slightly smoothed stability map is computed (black: more stable, red: less stable). Local optima are identified in step (2). The locations of these optima will be the seed regions used in the next step. In step (3) the seeds are grown into disjoint clusters, giving the finest clustering. Finally, in step (4), a spatially constrained hierarchical clustering method builds a cluster tree, giving not only a single parcellation, but an entire spectrum of parcellations at different resolutions (we here only show one of these).
Fig. 2
Fig. 2
Average Dice similarity between matched parcellations vs. parcellation level, calculated for parcellations from different datasets of the same subject before (A) and after (B) joining split clusters. Reproducibility results are shown for the data-set one subject which was scanned twice for 60 min. The number of parcels is the total across both hemispheres. Region growing approach with ~1000 (RG1000) and ~3000 (RG3000) seeds outperforms all other tested approaches over a range of parcellation resolutions, especially after parcel joining (B). Also shown is a small subset of the results obtained with other methods (including the next best performing method, NCUTS (NC IC) (Shi et al., 2000) used in Craddock et al. (2011), a spectral clustering approach to optimise network modularity (MC IC, black) (Newman, 2006), a hierarchical clustering approach using Ward's linkage rule (HW1C) (Ward, 1963) and the infomap algorithm (IM IC) (Ward, 1963) as used in Power et al., 2011, all with the same locally restricted correlation similarity measure. For comparison, the results obtained by the same approaches with a sparser similarity matrix (a correlation matrix in which values were thresholded so that only 1% of the entries in each column/row were non-zero (Power et al., 2011)) are also shown ({NC, MC, HW} t0.01C).).
Fig. 3
Fig. 3
Split-half parcellation reproducibility for the one subject from data-set one which was scanned twice. Shown are joined clusters derived from six 10 min rs-fMRI scans (left) and those derived from a different set of six 10 min rs-fMRI scans of the same subject (right). (The original parcellation had a resolution of 400 clusters (~200 per hemisphere)). Histogram inlays show the distribution of parcel sizes. Parcel colours have been matched to ease comparison.
Fig. 4
Fig. 4
Region growing results (A, B) and NCUTS results with locally constrained correlation (Craddock et al., 2011) (C, D). Path drawn on the cortical surface together with the parcels the path crosses (A, C) and the correlation (lower left part of the matrix) and connectivity (upper right part of the matrix, where connectivity is measured to the vertices marked in red in the figure) profiles along the path with parcel borders shown as blue lines (B, D). The colour bar above the similarity matrix matches the parcel colour for each location along the path. Shown are results for a typical subject.
Fig. 5
Fig. 5
Comparison of rs-fMRI parcellation borders and four t-fMRI activation maps for two different subjects. Region growing borders (at a resolution of 400 parcels) overlaid over four example task contrasts (p ≤ 0.05, uncorrected).
Fig. 6
Fig. 6
Comparison of rs-fMRI parcellation borders and t-fMRI ICA maps for two different subjects. Region growing method borders (at a resolution of 400 parcels) overlaid over example t-fMRI ICA maps derived from the same subject (ICA dimension = 20). ICA maps were matched visually for comparison.
Fig. 7
Fig. 7
Comparison of different methods. rs-fMRI cluster similarity to clusters derived from tfMRI data for the same subject. Top: Dice similarity between rs-fMRI clusters and clusters found with ICA applied to t-fMRI data. Bottom: Dice similarity between clusters from rfMRI to clusters found with GLM from t-fMRI data. The plus symbol (+) indicates the Dice mean (averaged over all parcels and over all subjects), whilst the triangles (⊳ and ⊲) indicate the mean plus and minus 3 standard deviations across parcels. The results shown here are for the region growing method, the infomap algorithm (Rosvall and Bergstrom, 2008) as used in Power et al. (2011) but with the local correlation similarity measure of Craddock et al. (2011), the NCUTS algorithm with a local correlation similarity measure (Craddock et al., 2011), a spectral clustering approach to optimise network modularity (again with a local correlation similarity measure) (Newman, 2006), a hierarchical clustering approach using Ward's linkage rule and the local correlation similarity measure (Ward, 1963). Also shown are results obtained by using spatial ICA followed by a winner takes all clustering in which each vertex is assigned to that cluster for which its normalised ICA map had the largest value and an iterative winner takes all algorithm, where a low-rank matrix decomposition is constructed by iterating two steps, a winner takes all cluster assignment and a reduction in approximation error.
Fig. 8
Fig. 8
Visual comparison of parcellation borders derived from one subject's data with myelin maps (Glasser and Van Essen, 2011) of the same subject. Solid white borders are borders at a resolution of 400 parcels for both hemispheres.
Fig. 9
Fig. 9
Region growing method borders (at a resolution of 400 parcels) overlaid over the composite atlas from Van Essen et al. (2011), registered to the individual subject.

References

    1. Beckmann CF, Smith SM. Probabilistic independent component analysis for functional magnetic resonance imaging. IEEE Trans. Med. Imaging. 2004;23(2):137–152. - PubMed
    1. Behrens TE, Johansen-Berg H, Woolrich MW, Smith SM, Wheeler-Kingshott CA, Boulby PA, Barker GJ, Sillery EL, Sheehan K, Ciccarelli O, Thompson AJ, Brady JM, Matthews PM. Non-invasive mapping of connections between human thalamus and cortex using diffusion imaging. Nat. Neurosci. 2003;6:750–757. - PubMed
    1. Bellec P, Perlbarg V, Saad J, Pelegrini-Issac M, Anton J-L, Doyon J, Benali H. Identification of large-scale networks in the brain using fMRI. Neuroimage. 2006;29:1231–1243. - PubMed
    1. Bellec P, Rosa-Neto P, Lyttelton OC, Benali H, Evans AC. Multi-level bootstrap analysis of stable clusters in resting-state fMRI. Neuroimage. 2010;51:1126–2239. - PubMed
    1. Biswal B, Yetkin FZ, Haughton VM, Hyde JS. Functional connectivity in the motor cortex of resting human brain using echo-planar MRI. Magn. Reson. Med. 1995;34(4):537–541. - PubMed

Publication types

LinkOut - more resources