. 2013 May:50-51:21-38.
doi: 10.1016/j.jchemneu.2013.02.007. Epub 2013 Mar 20.

Differential expression of vesicular glutamate transporters 1 and 2 may identify distinct modes of glutamatergic transmission in the macaque visual system

Affiliations

Differential expression of vesicular glutamate transporters 1 and 2 may identify distinct modes of glutamatergic transmission in the macaque visual system

Pooja Balaram et al. J Chem Neuroanat. 2013 May.

Abstract

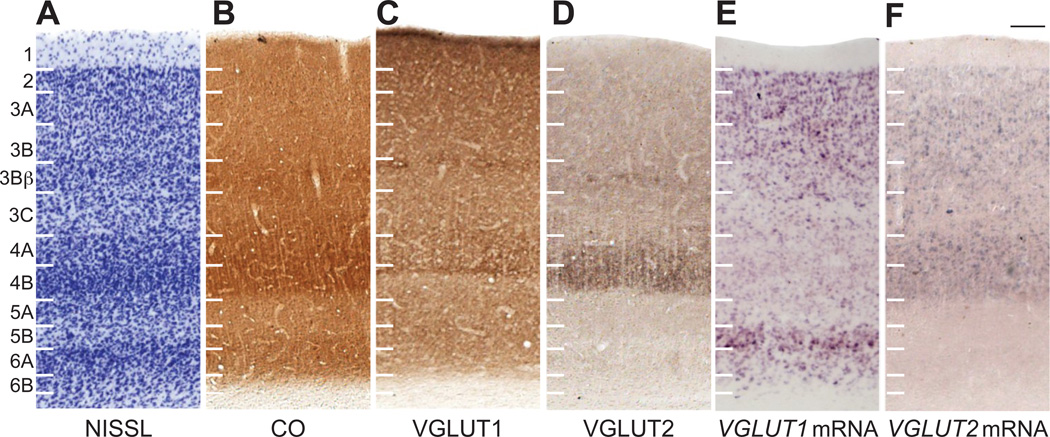
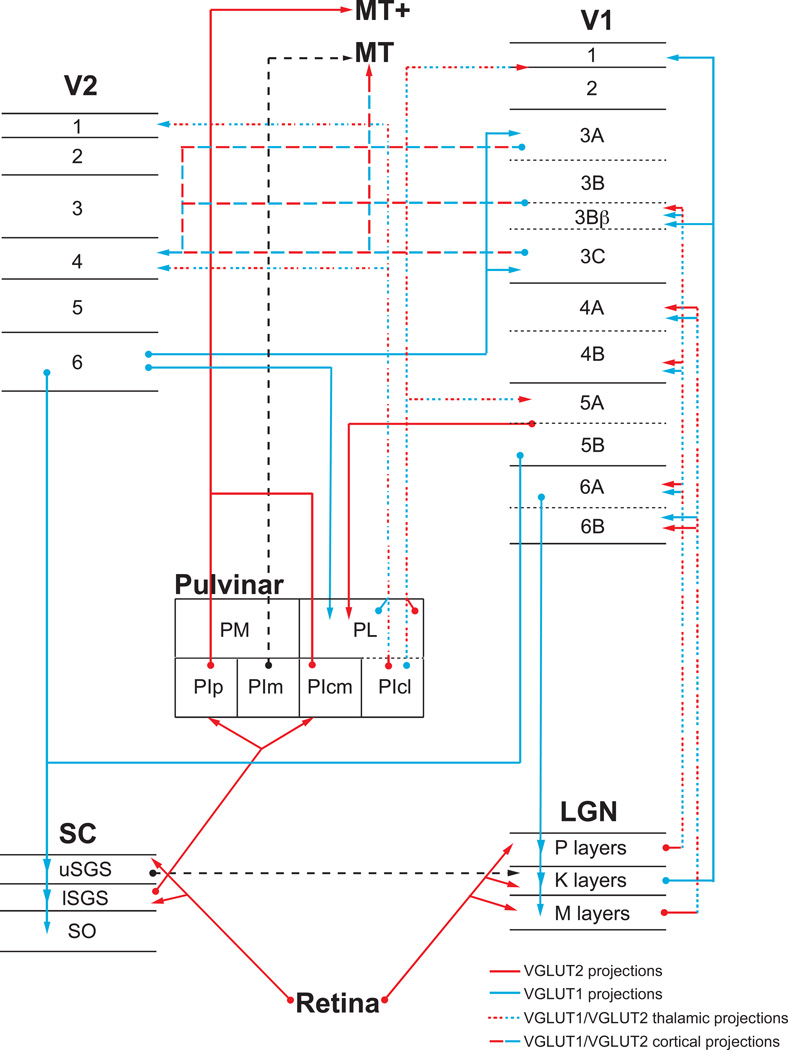
Glutamate is the primary neurotransmitter utilized by the mammalian visual system for excitatory neurotransmission. The sequestration of glutamate into synaptic vesicles, and the subsequent transport of filled vesicles to the presynaptic terminal membrane, is regulated by a family of proteins known as vesicular glutamate transporters (VGLUTs). Two VGLUT proteins, VGLUT1 and VGLUT2, characterize distinct sets of glutamatergic projections between visual structures in rodents and prosimian primates, yet little is known about their distributions in the visual system of anthropoid primates. We have examined the mRNA and protein expression patterns of VGLUT1 and VGLUT2 in the visual system of macaque monkeys, an Old World anthropoid primate, in order to determine their relative distributions in the superior colliculus, lateral geniculate nucleus, pulvinar complex, V1 and V2. Distinct expression patterns for both VGLUT1 and VGLUT2 identified architectonic boundaries in all structures, as well as anatomical subdivisions of the superior colliculus, pulvinar complex, and V1. These results suggest that VGLUT1 and VGLUT2 clearly identify regions of glutamatergic input in visual structures, and may identify common architectonic features of visual areas and nuclei across the primate radiation. Additionally, we find that VGLUT1 and VGLUT2 characterize distinct subsets of glutamatergic projections in the macaque visual system; VGLUT2 predominates in driving or feedforward projections from lower order to higher order visual structures while VGLUT1 predominates in modulatory or feedback projections from higher order to lower order visual structures. The distribution of these two proteins suggests that VGLUT1 and VGLUT2 may identify class 1 and class 2 type glutamatergic projections within the primate visual system (Sherman and Guillery, 2006).


Figures

Figure 1
Figure 1
(A–B) Sense and antisense staining of VGLUT1 and VGLUT2 mRNA in macaque thalamus sections confirms probe specificity. (C) Western blotting for VGLUT1 and VGLUT2 protein in macaque cerebellum lysate confirms antibody specificity for both proteins. Abbreviations: S, sense probe; AS, antisense probe.
Figure 2
Figure 2
Low magnification images through the macaque superior colliculus. Scale bar is 1mm, thalamic midline is to the left. Abbreviations: CO, cytochrome oxidase; SZ, zonal layer; uSGS, upper superficial gray layer; 1SGS, lower superficial gray layer; SO, optic layer.
Figure 3
Figure 3
High magnification images of VGLUT distributions in the superior colliculus. Laminar divisions are listed on the left, scale bar is 25um. Abbreviations: CO, cytochrome oxidase; SZ, zonal layer; uSGS, upper superficial gray layer; lSGS, lower superficial gray layer; SO, optic layer; SGI, intermediate gray layer.
Figure 4
Figure 4
Low magnification images through the pulvinar complex. Scale bar is 1mm, thalamic midline is to the left. Abbreviations: CO, cytochrome oxidase; PM, medial pulvinar; PL, lateral pulvinar; PIp, posterior inferior pulvinar; PIm, medial inferior pulvinar; PIcm, central medial inferior pulvinar; PIcl, central lateral inferior pulvinar; MGN, medial geniculate nucleus; LGN, lateral geniculate nucleus.
Figure 5
Figure 5
High magnification images of VGLUT distributions in the pulvinar complex. VGLUT2 protein (A, B) and VGLUT2 mRNA (A’, B’) expression distinguish three clear subdivisions in the inferior pulvinar. (C–Z) VGLUT1 and VGLUT2 distributions vary distinctly between medial, lateral, and inferior pulvinar subdivisions. Scale bars are 500um. Abbreviations: CO, cytochrome oxidase; PM, medial pulvinar; PL, lateral pulvinar; PIp, posterior inferior pulvinar; PIm, medial inferior pulvinar; PIcm, central medial inferior pulvinar; PIcl, central lateral inferior pulvinar; dLGN, dorsal lateral geniculate nucleus; MGN, medial geniculate nucleus.
Figure 6
Figure 6
Low magnification images through the lateral geniculate nucleus (LGN). Scale bar is 1mm, thalamic midline is to the left. Abbreviations: CO, cytochrome oxidase; ME, external magnocellular layer; MI, internal magnocellular layer; PI, internal parvocellular layer; PE, external parvocellular layer.
Figure 7
Figure 7
High magnification images of VGLUT distributions in the LGN. (G–H) Arrowheads show two different cell populations based on cell size. Scale bar is 500um. Abbreviations: CO, cytochrome oxidase; M, magnocellular; P, parvocellular; K, koniocellular.
Figure 8
Figure 8
Low magnification images of V1 and V2. (A) Coronal section of cytochrome oxidase (CO) reactivity in V1 and V2, showing region of interest for panels B–H. (B) Areal and laminar divisions of V1 and V2 in reference to panels C–H, adapted from Casagrande and Kaas (1994). Scale bars in panels A and B are 1mm.
Figure 9
Figure 9
High magnification images through V1. Laminar divisions indicated on the left, adapted from Casagrande and Kaas (1994). Scale bar is 500um.
Figure 10
Figure 10
High magnification images through V2. Laminar divisions indicated on the left, adapted from Casagrande and Kaas (1994). Scale bar is 500um.
Figure 11
Figure 11
Summary of major feedforward and feedback projections in the macaque visual system. Circles indicate origin of projection, arrowheads indicate termination of projection. Abbreviations: SC, superior colliculus {uSGS, upper superficial gray layer; lSGS, lower superficial gray layer; SO, optic layer}; LGN, lateral geniculate nucleus {P, parvocellular; K, koniocellular; M, magnocellular}; Pulvinar {PM, medial pulvinar; PL, lateral pulvinar; PIp, posterior inferior pulvinar; PIm, medial inferior pulvinar; PIcm, central medial inferior pulvinar; PIcl, central lateral inferior pulvinar}; V1, area V1; V2, area V2; MT, middle temporal area; MT+, MT associated areas (MTc, MST, FST, etc). Adapted from Casagrande and Kaas, 1994.

References

    1. Adams MM, Hof PR, Gattass R, et al. Visual cortical projections and chemoarchitecture of macaque monkey pulvinar. J Comp Neurol. 2000;419:377–393. - PubMed
    1. Aihara Y, Mashima H, Onda H, et al. Molecular cloning of a novel brain-type Na+-dependent inorganic phosphate cotransporter. J Neurochem. 2000;74:2622–2625. - PubMed
    1. Anderson JC, Martin KAC. The synaptic connections between cortical areas V1 and V2 in macaque monkey. J Neurosci. 2009;29:11283–11293. - PMC - PubMed
    1. Balaram P, Hackett TA, Kaas JH. VGLUT1 mRNA and protein expression in the visual system of prosimian galagos (Otolemur garnetti) Eye Brain. 2011;3:81–98. - PMC - PubMed
    1. Balaram P, Takahata T, Kaas JH. VGLUT2 mRNA and protein expression in the visual thalamus and midbrain of prosimian galagos (Otolemur garnetti) Eye Brain. 2011;3:5–15. - PMC - PubMed

MeSH terms

Substances

LinkOut - more resources