. 2013 Apr;19(4):488-93.
doi: 10.1038/nm.3092. Epub 2013 Mar 24.

Defective glucose metabolism in polycystic kidney disease identifies a new therapeutic strategy

Affiliations

Defective glucose metabolism in polycystic kidney disease identifies a new therapeutic strategy

Isaline Rowe et al. Nat Med. 2013 Apr.

Abstract

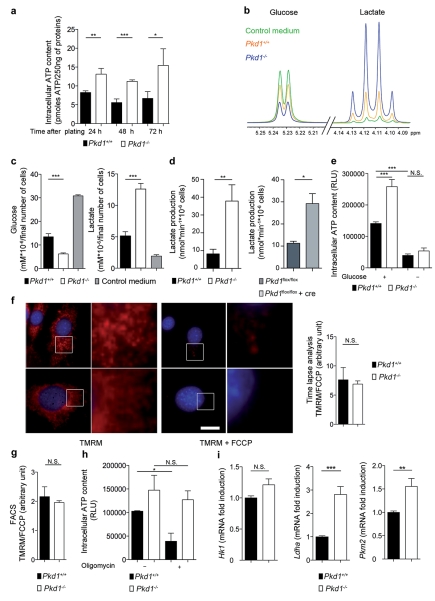
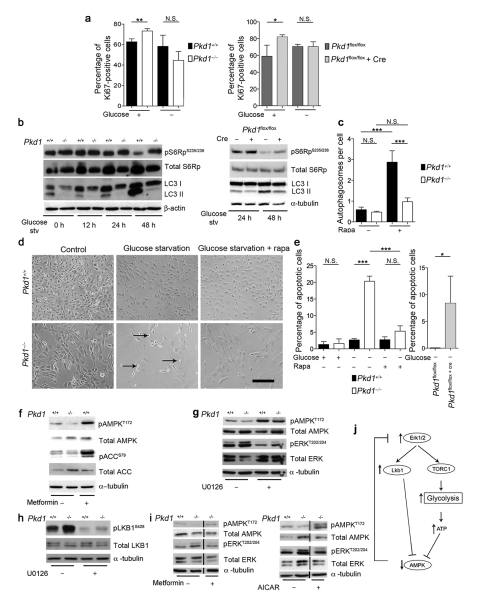
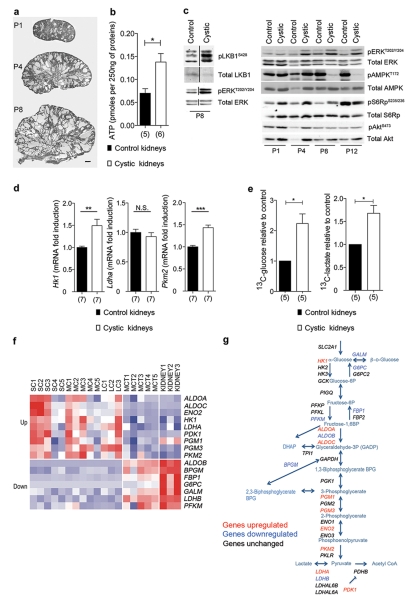
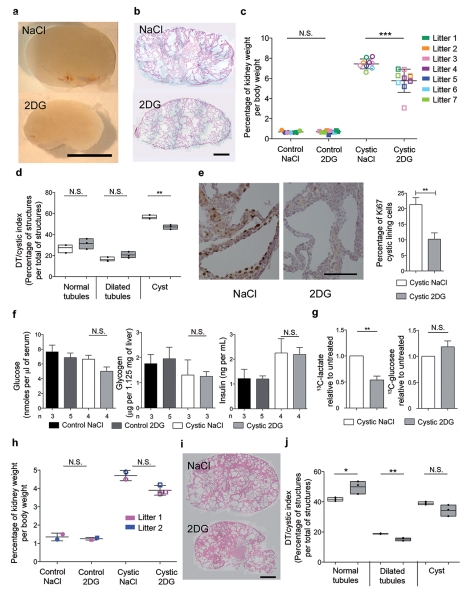
Autosomal dominant polycystic kidney disease (ADPKD) is a common genetic disorder characterized by bilateral renal cyst formation. Recent identification of signaling cascades deregulated in ADPKD has led to the initiation of several clinical trials, but an approved therapy is still lacking. Using a metabolomic approach, we identify a pathogenic pathway in this disease that can be safely targeted for therapy. We show that mutation of PKD1 results in enhanced glycolysis in cells in a mouse model of PKD and in kidneys from humans with ADPKD. Glucose deprivation resulted in lower proliferation and higher apoptotic rates in PKD1-mutant cells than in nondeprived cells. Notably, two distinct PKD mouse models treated with 2-deoxyglucose (2DG), to inhibit glycolysis, had lower kidney weight, volume, cystic index and proliferation rates as compared to nontreated mice. These metabolic alterations depend on the extracellular signal-related kinase (ERK) pathway acting in a dual manner by inhibiting the liver kinase B1 (LKB1)-AMP-activated protein kinase (AMPK) axis on the one hand while activating the mTOR complex 1 (mTORC1)-glycolytic cascade on the other. Enhanced metabolic rates further inhibit AMPK. Forced activation of AMPK acts in a negative feedback loop, restoring normal ERK activity. Taken together, these data indicate that defective glucose metabolism is intimately involved in the pathobiology of ADPKD. Our findings provide a strong rationale for a new therapeutic strategy using existing drugs, either individually or in combination.


Figures

Figure 1
Figure 1. Metabonomics revealed increased aerobic glycolysis in Pkd1−/− MEFs
a. ATP content in Pkd1−/− and Pkd1+/+ cells at the indicated times after plating. b. Overlay of 1H-NMR spectra corresponding to the glucose or lactate regions in the extracellular medium alone (control) or incubated in the presence of Pkd1+/+ or Pkd1−/− cells. c. Quantitative analysis of NMR spectra depict glucose and lactate concentrations in the medium derived from Pkd1−/− as compared to Pkd1+/+ cells. d. Quantification of lactate production using a commercial assay in Pkd1−/− cells as compared to Pkd1+/+ or in Cre-treated Pkd1flox/flox as compared to Pkd1flox/flox cells. e. Quantification of ATP content in Pkd1+/+ cells compared to Pkd1−/− cells after 48 h of glucose starvation. f-g. Mitochondrial membrane potential in Pkd1+/+ and Pkd1−/− labelled with the fluorescent dye TMRM (red) before and after treatment with FCCP (uncoupling the membrane potential) was measured by time-lapse microscopy (f) or FACS (g). h. Measurement of ATP content in Pkd1+/+ and Pkd1−/− MEFs treated in the presence of oligomycin for 5 h. i. Real time analysis of the genes coding Hk1, Pkm2 and Ldha was performed in Pkd1+/+ and Pkd1−/−MEFs. N.S.: P ≥0.05; *: P < 0.05; **: P < 0.01; ***: P < 0.001; Means +/− SD, except for i means +/− SEM. Data are representative of three independent experiments performed in triplicate. In f and i the average value of all three experiments is provided. T-test in a, c, d, f, g and i; ANOVA followed by Bonferroni’s test in e and h. Bar = 10 μm.
Figure 2
Figure 2. Glucose-dependence, defective autophagy and altered AMPK and ERKs in Pkd1−/− cells
a. Percentage of cells positive for Ki67 over total cells with or without 12 h glucose-starvation in Pkd1−/− (left) or Cre-treated Pkd1flox/flox cells (right). b. LC3-II western-blot upon glucose starvation for 12, 24 and 48 h in Pkd1+/+ and Pkd1−/− cells (left) or 48 h in Cre-treated Pkd1flox/flox cells (right). c. Quantification of the number of autophagosomes per cells evaluated by EM (Supplementary Fig. 3) in the presence or absence of rapamycin (50 nM). d. Cells were glucose-starved for 48 h in the presence or absence of rapamycin (20 nM) and bright field images captured. Arrows indicate dying cells. e. Quantification of apoptosis using the TUNEL assay after glucose starvation in Pkd1−/− and Pkd1+/+ cells (left) or Cre-treated Pkd1flox/flox MEFs (right). f. P-AMPK in Pkd1−/− cells. g. P-AMPK, P-ERK and P-S6RP in Pkd1−/− MEFs after 12 h in UO126 (30 μM). h. P-LKB1 in Pkd1−/− cells was decreased with 30 μM of UO126 (12 h). i-j. P-AMPK, P-ERK and P-S6RP in MEFs after treatment with 2 mM metformin (enhancing AMPK activity, left) or 2 mM AICAR (mimicking ADP, right) for 4 h showing ERK down-regulation in Pkd1−/− cells. k. Model of the molecular mechanism leading to increased aerobic glycolysis in ADPKD. N.S.: non significant; *: P < 0.05; **: P < 0.01; ***: P < 0.001; Means +/− SD are shown. T-test in a and e graph on the right; ANOVA followed by Bonferroni’s in a, c and e on the left. Graphs are representative of at least three independent experiments performed in triplicate. Bar = 200 μm.
Figure 3
Figure 3. Defective Glycoslysis and ERKs/AMPK axis in vivo
a. Representative images of Ksp-Cre:Pkd1−/flox kidneys at P1, P4 and P8. b. Measurement of ATP content in Ksp-Cre:Pkd1−/flox kidneys compared to control kidneys at P4. c. Right. Western blot analysis of pERK, pS6Rp and pAMPK in P1, P4, P8 and P12 Ksp-Cre:Pkd1flox/ kidneys. pAkt levels (S473) do not appear to change. Left. pLKB1 levels P8 in the cystic kidneys compared to control. d. Real time analysis of the genes coding for key glycolytic enzymes Hk1, Pkm2 and Ldha performed in KspCre:Pkd−/flox kidneys as compared to control kidneys (Ksp-Cre:Pkd1+/flox) at P4. e. The content of 13C-glucose in cystic kidneys (Ksp-Cre:Pkd1−/flox) was significantly higher compared to control non-cystic kidneys (Ksp-cre:Pkd1+/flox) (left, n = 5). Significantly increased levels of 13C-lactate (right, n = 5) could be detected in the cystic kidneys at P8. f. Panels showing genes coding for glycolytic and glucogenesis enzymes differentially expressed between the cysts and MCT samples. Up-regulated genes are shown in red, and down-regulated genes, in blue. SC, small cysts; MC, medium cysts; LC, large cysts; MCT, minimally cystic tissue; KIDNEY, normal renal cortical tissue. g. The scheme shows the glycolytic cascade, in red are indicated the genes up-regulated, in blue the ones down-regulated and in black the ones unchanged in cystic kidneys from ADPKD individuals compared to the normal kidneys. N.S.: P ≥0.05; *: P < 0.05; **: P < 0.01; ***: P < 0.001; Mean +/− SEM; the number of kidneys of three litters is indicated under the columns. Bar = 500 μm
Figure 4
Figure 4. Treatment with 2DG ameliorates cystic kidney disease in two ADPKD orthologous models
a. Representative example of P8 Ksp-Cre:Pkd−/flox kidneys treated daily (from P6 to P8) with 500 mg/kg 2DG or with vehicle (NaCl). b. Representative examples of the histology of kidneys treated as in a. c. Ratio of kidney-over-body weight in controls or mutant littermates (each litter in a different color) after treatment with 2DG or NaCl. d. Cystic index in 2DG vs NaCl-treated KspCre:Pkd1−/flox kidneys shows a significant reduction in the number of cysts in 2DG-treated animals. e. Ki67 assay shows the proliferation index in the Ksp-Cre:Pkd1−/flox mice treated with 2DG vs vehicle (NaCl). Right: quantification of Ki67 in the cyst-lining epithelium in 2DG vs NaCl-treated kidneys. f. Serum concentrations of glucose and insulin and liver levels of glycogen in littermate controls and mutant Ksp-Cre:Pkd1flox/ kidneys treated with 2DG or with vehicle (NaCl). g. 13C-lactate levels are significantly reduced in the Ksp-Cre:Pkd1flox/ cystic kidneys treated with 2DG as compared to vehicle-only treated, while the levels of 13C-glucose remain higher in the 2DG treated kidneys. h. Kidney-over-body weight in Pkd1v/v mice treated with 500 mg/kg 2DG from P5 until P7. i. Cystic kidneys from Pkd1v/v mice treated with 2DG as in h. N.S.: P ≥ 0.05; *: P < 0.05; **: P < 0.01; ***:P < 0.001. e, f and g Mean +/− SEM; c and h Mean +/− SD. Statistical analysis by ANOVA followed by Bonferroni’s test in d, f and j; t-test in e and g; Mann-Whitney test in c and h. Bar = 5mm in a, 1 mm in b, 100 μm in e and 1 mm in i.

Comment in

References

    1. Torres VE, Harris PC, Pirson Y. Autosomal dominant polycystic kidney disease. Lancet. 2007;369:1287–301. - PubMed
    1. Harris PC, Torres VE. Polycystic kidney disease. Annu Rev Med. 2009;60:321–37. - PMC - PubMed
    1. Takiar V, Caplan MJ. Polycystic kidney disease: pathogenesis and potential therapies. Biochim Biophys Acta. 2011;1812:1337–43. - PMC - PubMed
    1. Grantham JJ, Geiser JL, Evan AP. Cyst formation and growth in autosomal dominant polycystic kidney disease. Kidney Int. 1987;31:1145–52. - PubMed
    1. Torres VE, et al. Prospects for mTOR inhibitor use in patients with polycystic kidney disease and hamartomatous diseases. Clin J Am Soc Nephrol. 2010;5:1312–29. - PMC - PubMed

Publication types

MeSH terms